Gold surged past US$2,000/oz earlier this week,1 nearly reaching the previous 2020 record.2 This time, though, it was driven by continued concerns about the war in Ukraine, swelling commodity prices, and, more generally, the potential implications for the global economy. And while the gold price has come down from the week’s high, it’s still approximately 4% higher month-to-date.3
Against this backdrop, we are addressing the three questions investors have asked us most frequently in recent days.
What is the relationship between the price of oil and the price of gold, and what can the oil market tell us about gold’s future performance?
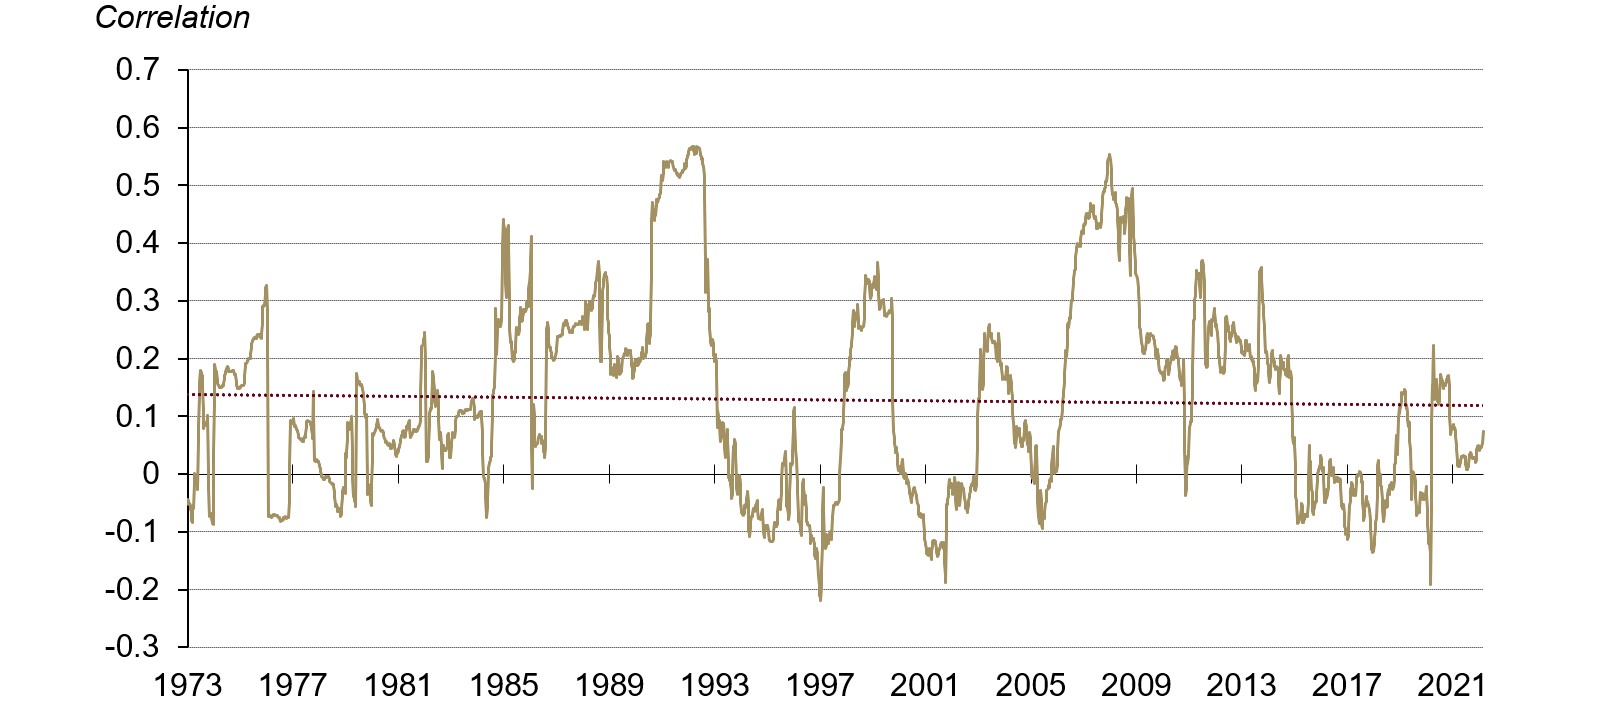
Generally, there’s no consistent relationship between gold and oil (Chart 1). The long-term correlation between the two assets is close to zero – ranging from -0.2 to +0.5 at any given time.
However, both gold and oil tend to perform well in periods of high inflation, albeit for different reasons. High oil prices can push consumer price baskets higher, which can result in high inflation. When high inflation persists, driven by commodities or other factors, investors look for hedges, often lifting gold investment demand – and its price – higher. In this case, the gold price tends to lag the movement in commodities, but gold has historically outperformed longer term.
So, while oil prices do not “cause” the gold price to rise – or fall – the economic environment that leads to a surge in oil can also result in higher gold prices.
The war in Ukraine is one such environment, as it stems from a geopolitical event with likely significant economic consequences, as well as an impact on energy prices, other commodities, and additional supply-chain disruptions more generally.
Indeed, commodity prices have risen exponentially in recent weeks. And while this could extend if the war continues, any potential resolution may bring prices crashing down. However, we don’t believe gold would see the same level of volatility even if it experiences a price correction. Gold supply has not experienced the same magnitude of disruption as other commodities and, in any case, vast above-ground stocks and much higher trading volumes of physical gold reduce the impact of newly mined supply. Some of the recent more tactical positions on gold could be liquidated, but we suspect that the surge in demand has also been driven by more strategic investors, looking for longer-term diversification and risk hedging which, together with opportunistic buying should the gold price fall, could cushion the potential pullback.
Chart 1: There is no consistent long-term relationship between gold and oil
Two-year rolling correlation between gold and oil returns*
*As of 4 March 2022. Based on rolling two-year correlation of monthly returns of oil and gold. The LBMA PM fix price is used for the price of gold, and the oil prices are determined via the Bloomberg Historical Oil Price Index as well as the Bloomberg WTI Crude Oil Sub Index Total Return.
Source: Bloomberg, ICE Benchmark Administration, World Gold Council
How likely is it that the global economy falls into stagflation and how may gold perform in this environment?
The risk of stagflation around the world is certainly rising. Europe may feel it most acutely, fuelled by a combination of soaring commodity prices, energy dependency, and a weaker economic and financial environment – all of this now exacerbated by the war in Ukraine.
And while stagflation is also a risk for the US, it may not reel to the same extent. Both hard and soft economic data still signal that the US economy is resilient. However, if the spread between long and short maturity US Treasury bonds – a historically reliable bellwether for the economy – continues to flatten or inverts, it may signal that market participants anticipate a contraction down the line. Should energy and food prices stay high, stagflation risks might just be realised.
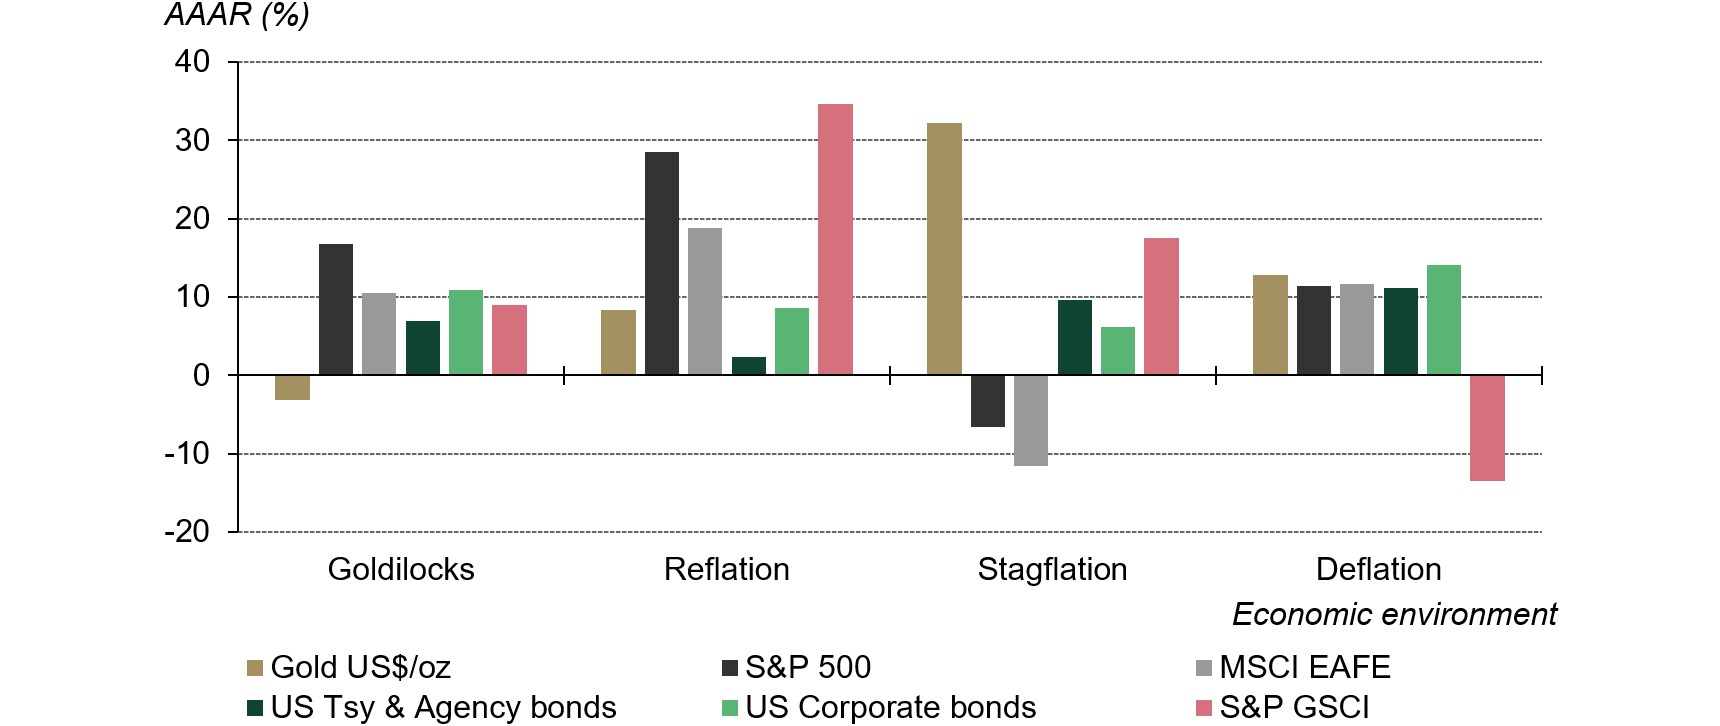
In October last year we wrote about gold’s historical performance during stagflationary conditions. With these risks now rising again we want to highlight the findings of that analysis. Needless to say, stagflationary environments are not good at all for financial markets, nor the economy. Slowing incomes and rising prices are an uneasy combination to say the least. Equities are historically hit hardest, while commodities and gold have done well (Chart 2). We are already seeing these dynamics play out in the beginning of 2022 and gold appears to be doing exactly what investors would expect it to. Performing well as a hedge when other assets are not.
Chart 2: Gold has historically performed well in periods of stagflation
Annualised average adjusted return (AAAR) for major asset classes since Q1 1973*
Could recent geopolitical developments, including the war in Ukraine, change the role of the US dollar in foreign reserves and global trade?
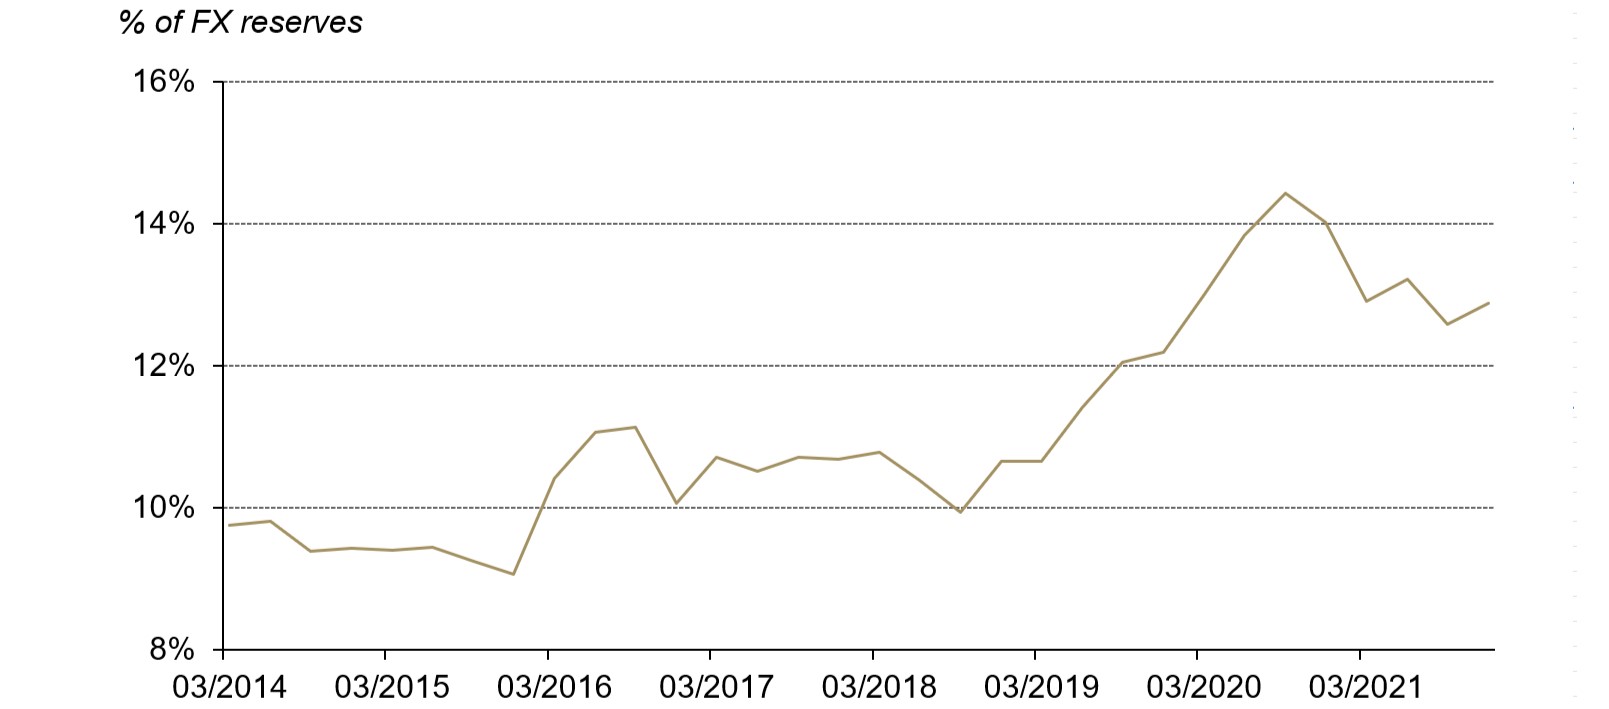
The role of the US dollar in international trade is well established, but the world has been slowly moving towards a more “multicurrency” system, especially with the increasing relevance of China in international trade. While gold is not an official currency, it’s an important part of the monetary system, especially in its role as a high-quality and liquid component to foreign reserves. In addition, contrary to fiat currencies, gold bullion is no one’s liability. And while it’s not often used as a direct means of exchange, it’s often an invaluable source of collateral and a hedge against systemic risk events. This partly explains the increase in demand for gold by central banks over the past decade (Chart 3), especially those from emerging markets that historically had a large percentage of US dollar assets in their foreign reserves.
Chart 3: Gold has been increasing as a strategic component to foreign reserves
Gold as a percentage of world foreign reserves*
*As of Q4 2021.
Source: IMF International Financial Statistics, World Gold Council
Footnotes
The LBMA Gold Price PM reached US$2,039.05/oz on 8 March, while the gold spot price, given by Bloomberg’s XAU composite, saw an intra-day high of US$2,070.44 the same day.
The LBMA Gold Price PM hit a historical record of US$2,067.15/oz on 8 August 2020, with the intra-day price (XAU) moving as high as US$2,075.47/oz the day before.
Based on the LBMA Gold Price PM USD as of 10 March 2022.