- Is the current commodity rally just another reflationary episode or something more pervasive?
- Recent market moves in commodities rank in the top 5% of six-month moves since 1971
- Gold's weak performance so far is consistent with previous reflationary episodes – its time to shine may yet come.
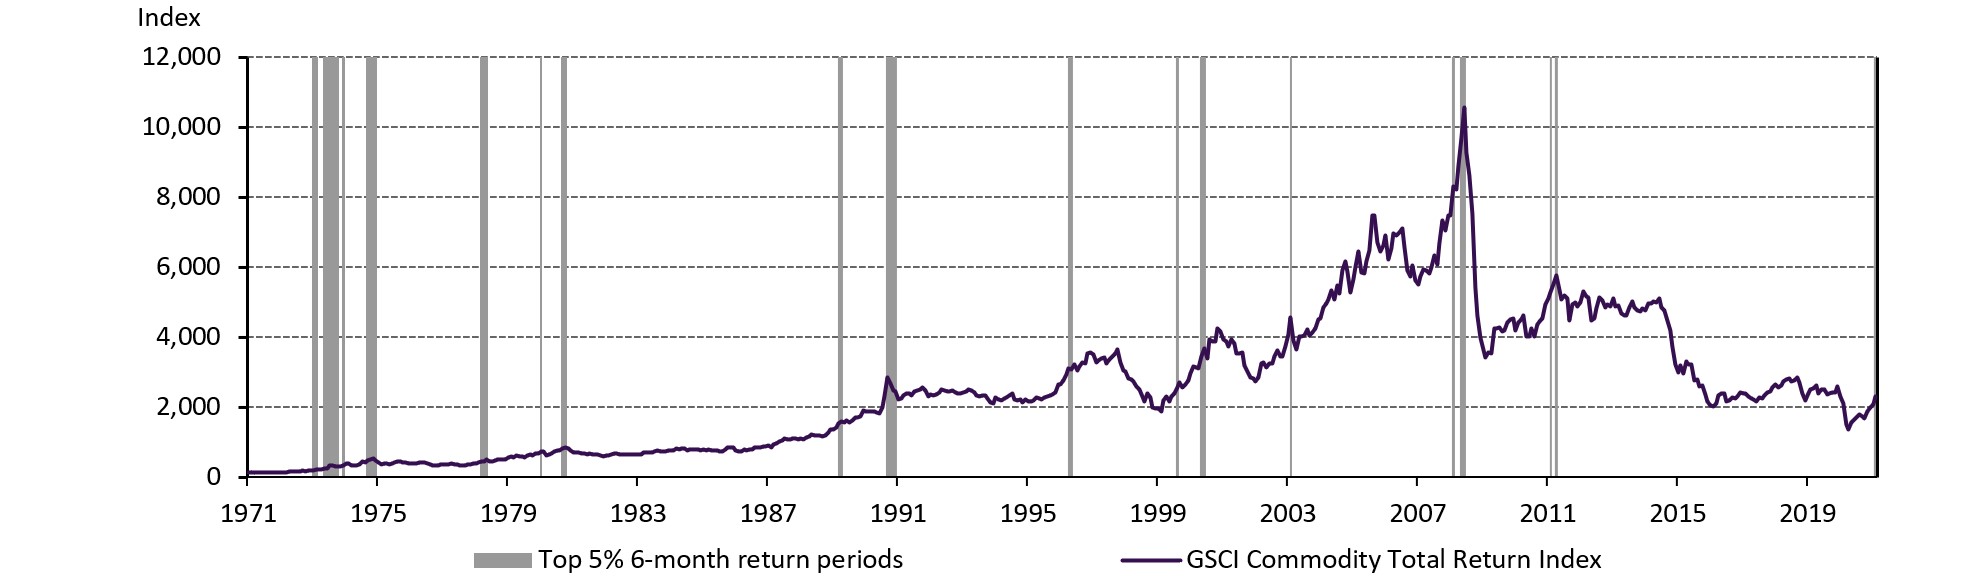
A commodity rally began in Q2 of 2020, sharply on the heels of the COVID-19-driven broad market sell-off. It started with metals, followed by energy, and, by the summer, agricultural commodities had joined in. Investors have waited more than a decade for this type of commodities rally but perhaps their patience is about to be rewarded. The recent market moves – between August 2020 and February 2021 – now rank in the top 5% of six-month moves since 1971 and, with a 30-year low as a base, this suggests they could have further to go (Charts 1 and 2).
Chart 1. A long wait for a strong run from a low base
S&P GSCI Commodity Total Return Index from January 1971 to February 2021*
*The grey shaded areas denote six-month returns that are in the top 5% of all six-month returns.
Source: Bloomberg, World Gold Council
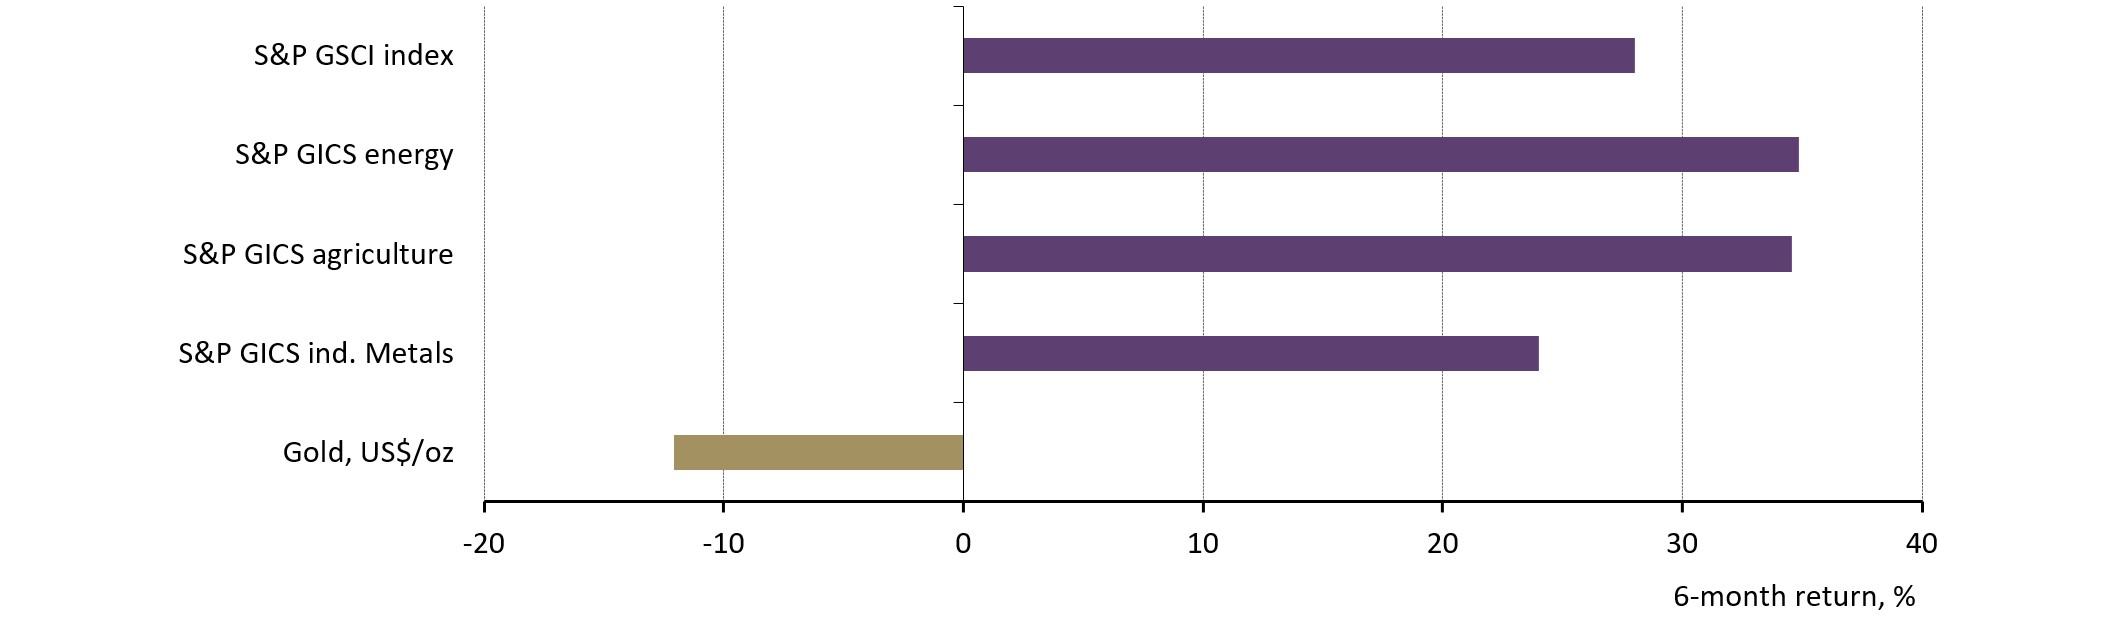
Chart 2. As commodities reflate, gold is left behind
S&P GSCI Commodity Total Return Index, GSCI Commodity sectors and spot US$ gold from August 2020 to February 2021*
*All series are GSCI Total Return series except for spot US$ gold.
Source: Bloomberg, World Gold Council
In an environment where many assets appear expensive, commodities stand out as an enticing prospect for return-hungry investors. However, if this run is likely to continue and simultaneously perhaps stoke inflation in the process, why is gold yet to shine?
Firstly, it is important to reiterate that while gold shares characteristics with other commodities and is represented in the large commodity indices, it is a financial asset first and foremost. Its behaviour is different, often countercyclical when commodities are procyclical, and with diversified sources of supply and demand. As such it is not subject to disruptions in any one sector.
Secondly, if the recent commodities run is a reflation story, some precedents are worth exploring to help investors navigate current market dynamics.
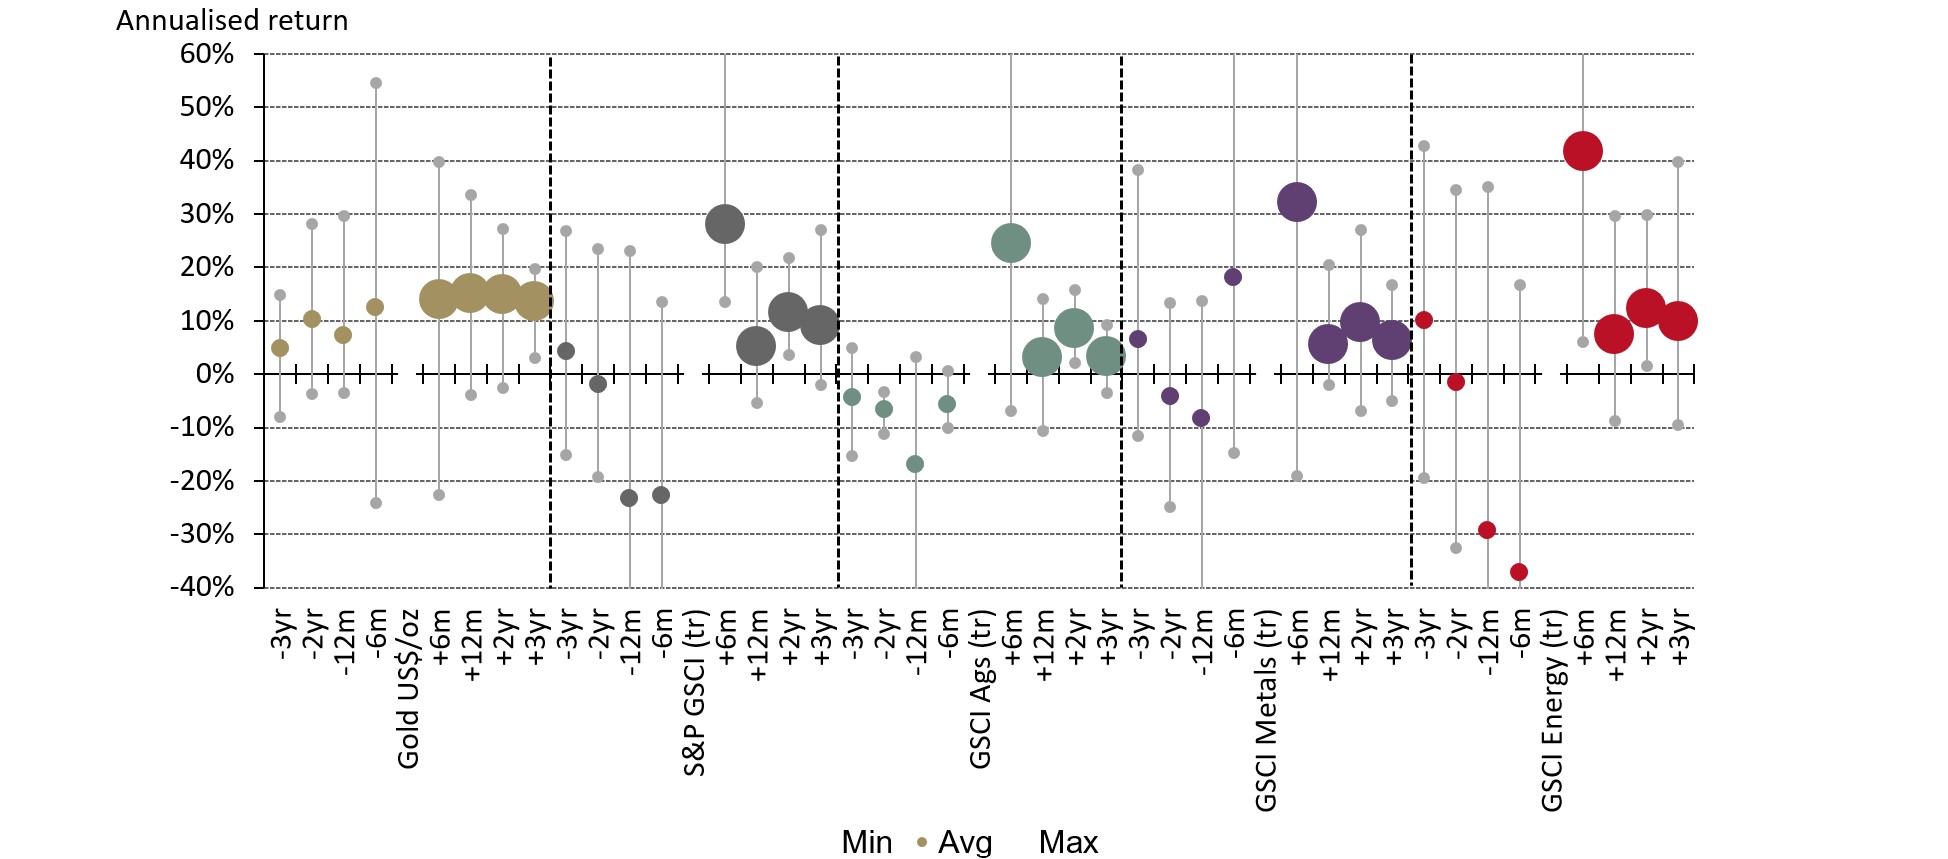
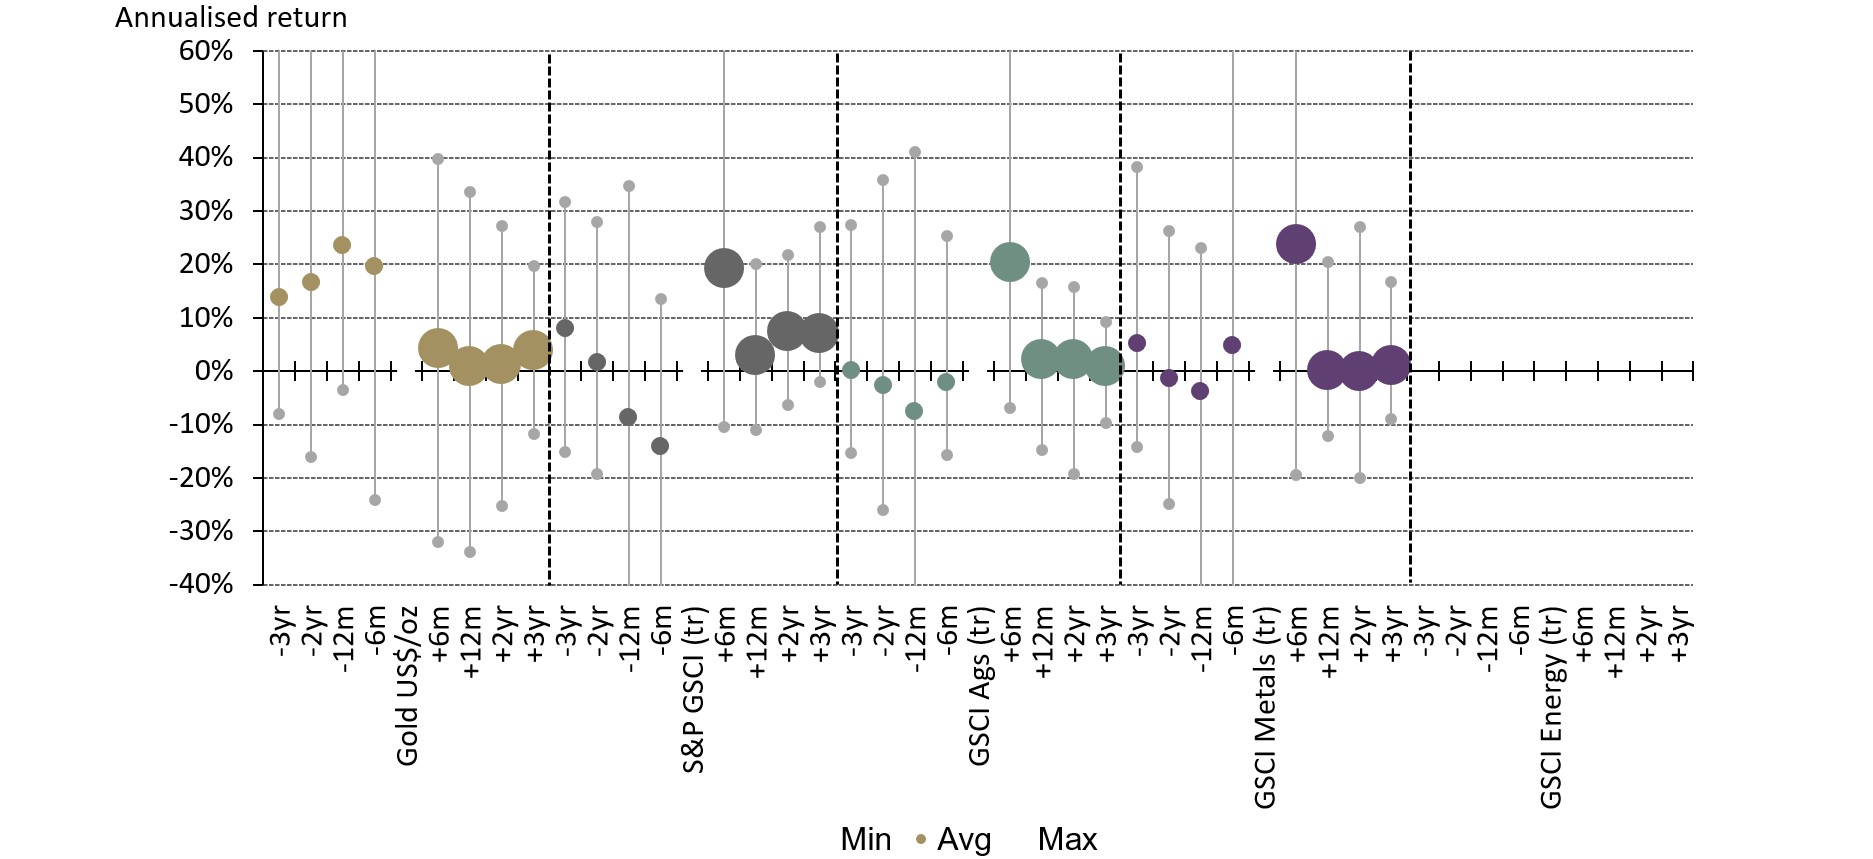
‘Reflation’ is loosely characterised as an environment of resurgent economic growth twinned with rising inflation and interest rates. Defining ‘reflation’ as the period after a recession,1 Chart 3 shows how gold and commodities have fared, on average, up to three years before and after the start of the reflation period since 1991. Chart 4 expands the period of analysis by including both the 1980 and 1982 recessions, although we lose the impact on energy commodities as total return series are unavailable for that period. The key dots to focus on are the first and last large dots for each series, representing average six-month and three-year returns after the start of a period of reflation, respectively.
Chart 3. Commodities have started reflationary periods with a bang, but gold has caught up
S&P GSCI Commodity Total Return Indices and spot US$ gold performance before and after US recessions*
*Each dot in the chart represents the annualised return for a series. The large dots show performance after the reflation period began and the small dots show the performance prior. Each dot also shows the high and low ranges of returns. All series are GSCI Total Return series except for spot US$ gold. The period analysed is March 1988 to February 2020.
Source: Bloomberg, World Gold Council
Chart 4. Adding the 1980 and 1982 reflationary periods tells a similar story but at lower absolute levels
S&P GSCI Commodity Total Return Indices and spot US$ gold performance before and after US recessions*
*Each dot in the chart represents the annualised return for a series. The large dots show performance after the reflation period began and the small dots show the performance prior. Each dot also shows the high and low ranges of returns. All series are GSCI Total Return series except for spot US$ gold. The period analysed is November 1979 to February 2020.
Source: Bloomberg, World Gold Council
Gold’s current underperformance between August 2020 and February 2021 is consistent with its average performance during previous reflationary episodes. Similarly, the current outperformance observed in major commodity groups is in line with their historical performance. Interestingly, gold fared well, both relatively and absolutely, in the months leading up to a period of reflation. Conversely, the opposite is true of the rest of the commodity complex, with energy posting the worst average performance over the preceding six months.
So, this initial ‘rotation’ from the safety of gold to the return potential from commodities makes sense in this most recent period. Also, let’s not forget that gold hit an all-time high of US$2,067.15 in August 2020,2 which may have compelled some investors to take profit.
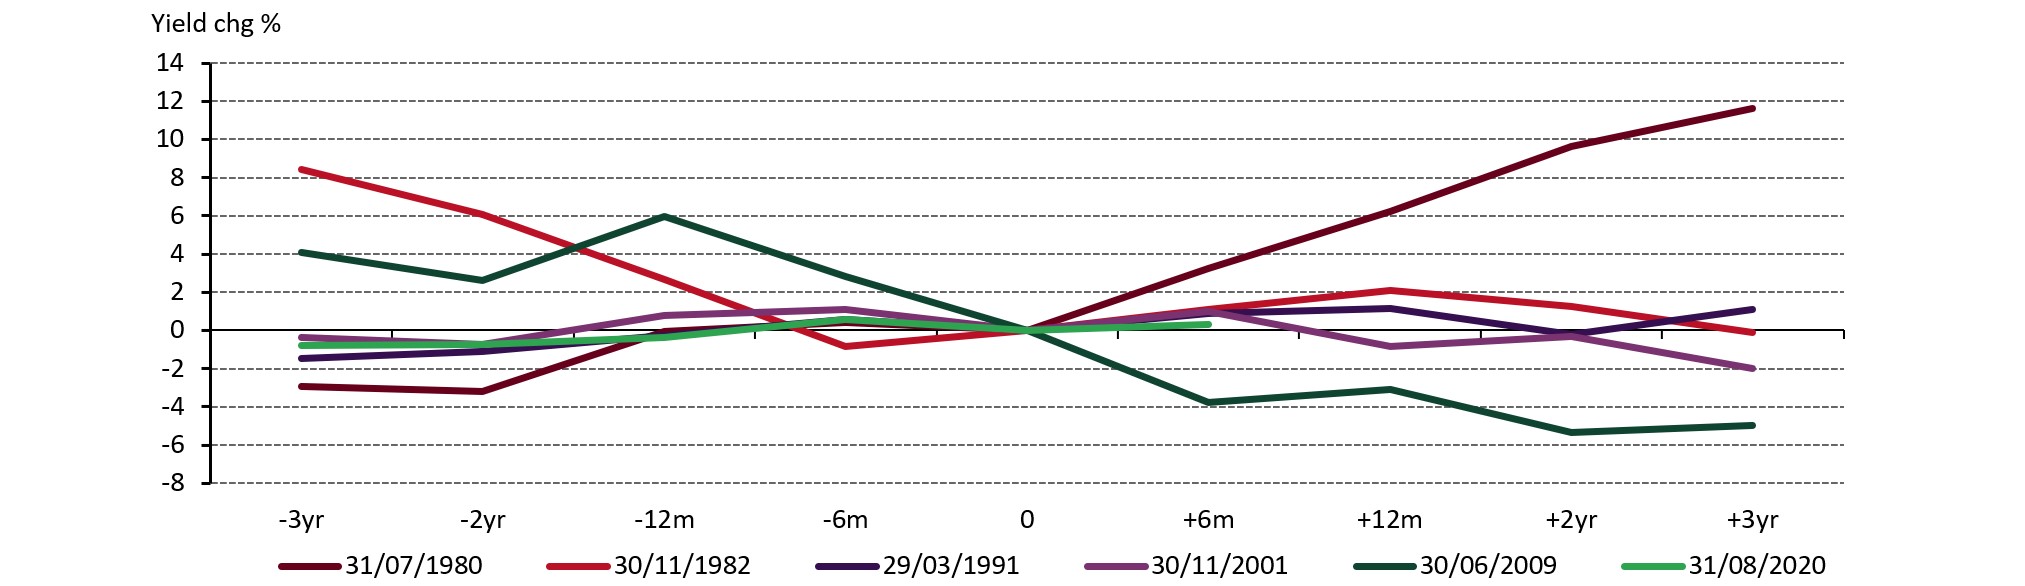
Another plausible reason for gold’s relative underperformance has been the initial pick-up in both interest rates and equity returns, which both increase the opportunity cost of holding gold. Charts 5 and 6 show that gold didn’t fare as well in reflationary environments where real interest rates rose.3 From July 1980, real rates rose almost 12%, three years into the reflationary episode. It was undoubtedly a major factor in driving gold prices down: they ended the three-year period down an annualised 12%. This also followed through into the 1982 reflation period.
Chart 5. A major headwind for gold prices in the early 1980s was the significant rise in real yields…
Relative change in real yields before and during reflation periods*
*Chart shows the performance of ‘realised’ real yields (US 10-year Treasury yield less US headline CPI) three years before and three years into a reflation period. 0 is the end of an NBER recession. The period analysed is November 1979 to February 2020.
Source: Bloomberg, World Gold Council
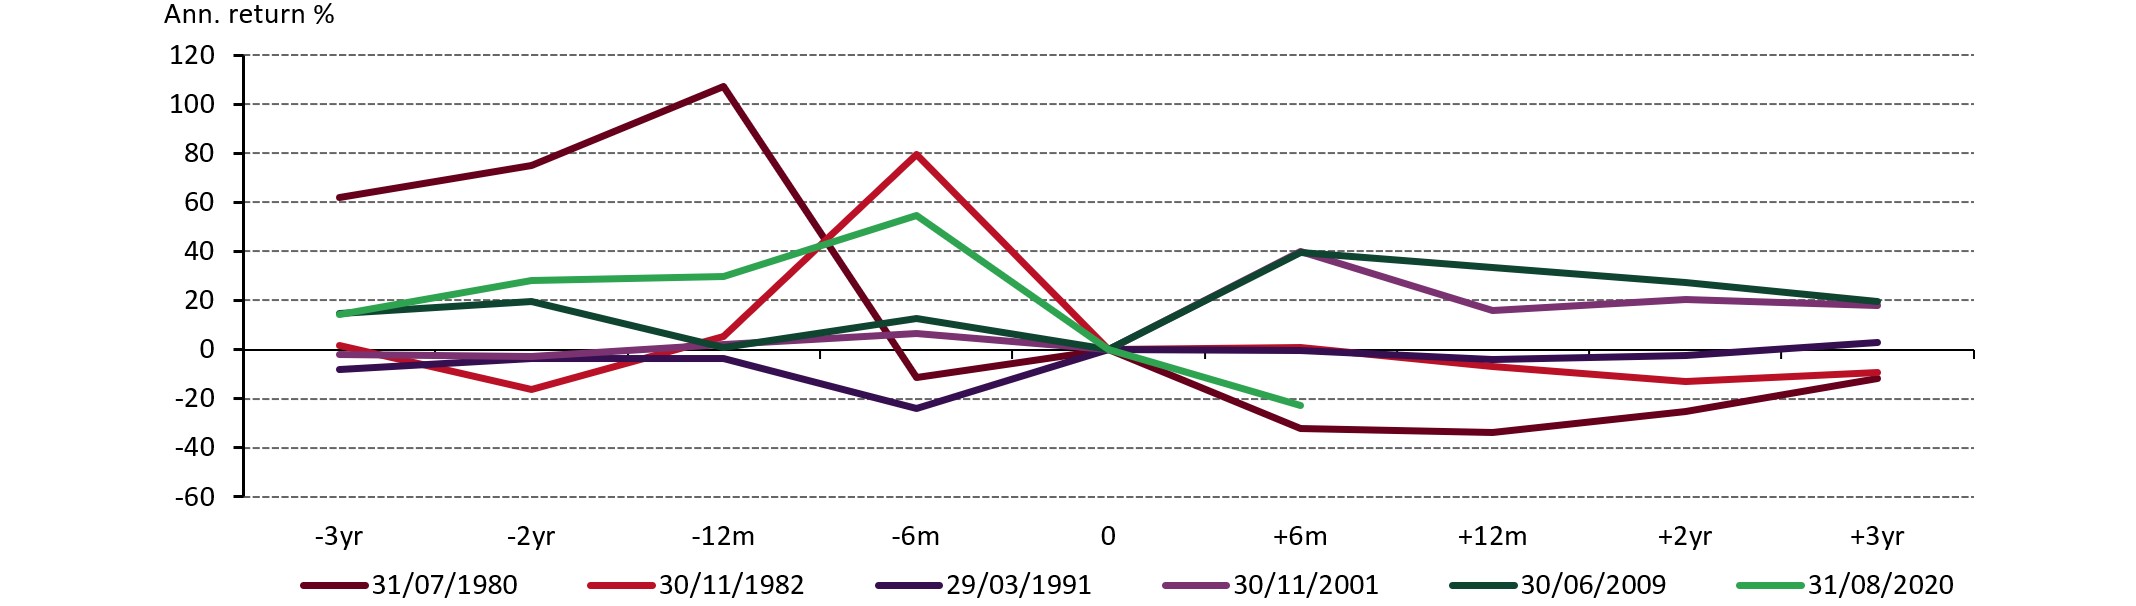
Chart 6. ...a factor in gold’s weak performance during those reflationary periods in absolute terms
Relative change in real yields before and during reflation periods*
* Chart shows the performance of spot gold in US$/oz, three years before and three years into a reflation period. 0 is the end of an NBER recession. The period analysed is November 1979 to February 2020.
Source: Bloomberg, World Gold Council
Despite initial headwinds, gold has on average caught up to most major commodity groups by the second and third years from the start of a reflationary period since 1991. It has also caught up to metals and agricultural commodities since 1980. And while the absolute level of returns vary, gold has done well against commodities on a relative basis.
In our view, the analysis using data since 1991 may be more indicative of the current environment since central banks’ commitment to accommodative policy should prevent real rates from rising in a similar fashion to the early 1980s.4
The 2009 period of reflation saw the best absolute and relative performance for gold. Its high returns likely reflected lingering concerns about the health of the global economy and concerns about inflation driven by quantitative easing, among other things. On top of this, higher growth amidst ongoing uncertainty meant that both investors and consumers were supporting price rises. If economies recover this year and next from the COVID-19-related slowdown, it is conceivable that we could see a similar pattern emerge: growth supporting the consumer and high global debt, continued liquidity stimulus and record high valuations in equity and bond markets keeping investors on board.
Footnotes
Using National Bureau of Economic Research (NBER) recession index (RINDEX Index) via Bloomberg to determine analysis starting points. In our analysis a reflation begins during the last month of the NBER recession.
Based on the all-time high reached by the LBMA Gold Price PM USD during 6 August 2020.
Real interest rates defined as US 10-year Treasury yield less US headline Consumer Price Index (CPI) inflation.
Federal Reserve issues FOMC statement, 17 March 2021