October highlights
- Gold fell 2% in October1 on rising bond yields and dollar strength, but it was positively impacted by higher breakeven inflation
- But a weaker US dollar vs. euro and lower ETF outflows provided some support
Looking forward
- US midterm elections are upon us. Historically, midterms have been very positive for equities but only mildly supportive for gold. We don’t see election results having a meaningful impact gold this time either, and is more likely to take its cue from the US dollar and monetary policy as it has this so far this year
- Central banks dialling back aggressive rhetoric, slower ETF outflows and short-covering risk in COMEX futures may signal a brighter few weeks ahead
Tactical flush-out
Gold fell for the seventh consecutive month, dropping 2% in October to US$1,639/oz. Despite a strong start to October, gold prices wavered by the end of the first week and drew down to where they had opened by the middle of the month. It would have been a positive month, if not for a final Friday slump on Oct 28th. The slight gold price fall came amidst strong monthly gains in equities (+9 %) and flat bond prices.
In stark contrast to recent strong retail investment demand as reported in the most recent Gold Demand Trends, gold ETFs shed another 64t in October. Futures positioning followed suit, with managed money reaching a net short of 103t, only just shy of the level seen at the end of September.
Our Gold Return Attribution Model (GRAM) model captured October’s return accurately (Chart 1). Absent was the large residual we observed during several months in 2022, perhaps reflecting a lower geopolitical risk premium, rather than any meaningful increase in interest rate or US dollar sensitivity. As discussed last month, our analysis suggests that investors’ interest rate expectations have converged with those of the Fed, meaning that further hikes are more likely priced in. GRAM also showed support from lower ETF outflows, a stronger euro and higher net longs.
Chart 1: A surging dollar, rising rates and negative investor sentiment pushed gold lower in October
A surging dollar, rising rates and negative investor sentiment pushed gold lower in October
Contributions of gold price drivers to periodic gold returns*
A surging dollar, rising rates and negative investor sentiment pushed gold lower in October
Contributions of gold price drivers to periodic gold returns*
*To 31 October 2022. Our Gold Return Attribution Model (GRAM) is a multiple regression model of monthly gold price returns, which we group into four key thematic driver categories of gold’s performance: economic expansion, risk & uncertainty, opportunity cost, and momentum. These themes capture motives behind gold demand; most poignantly, investment demand, which is considered the marginal driver of gold price returns in the short run. ‘Unexplained’ represents the percentage change in the gold price that is not explained by factors currently included in the model. Results shown here are based on analysis covering an estimation period from February 2007 to October 2022.
Sources:
Bloomberg,
World Gold Council; Disclaimer
*To 31 October 2022. Our Gold Return Attribution Model (GRAM) is a multiple regression model of monthly gold price returns, which we group into four key thematic driver categories of gold’s performance: economic expansion, risk & uncertainty, opportunity cost, and momentum. These themes capture motives behind gold demand; most poignantly, investment demand, which is considered the marginal driver of gold price returns in the short run. ‘Unexplained’ represents the percentage change in the gold price that is not explained by factors currently included in the model. Results shown here are based on analysis covering an estimation period from February 2007 to October 2022.
Table 1: Gold’s y-t-d performance continues to remain positive for investors outside the US
Gold price and return in different periods across key currencies*
*As of 31 October 2022. Based on the LBMA Gold Price PM in local currencies: US dollar (USD), euro (EUR), Japanese yen (JPY), pound sterling (GBP), Canadian dollar (CAD), Swiss franc (CHF), Indian rupee (INR), Chinese yuan (RMB), Turkish lira (TRY), and Australian dollar (AUD).
Source: Bloomberg, ICE Benchmark Administration, World Gold Council
Looking ahead…
Midterm matters?
- US midterm elections arrive on 8th November. They have historically been very positive for equities, and gold hasn’t fared badly either
- Media focus on midterms is high, but investors seem less interested, with Fed policy, high inflation and recession more dominant themes
- In our view, gridlock or a Republican sweep would both more likely favour equities, while a democratic sweep would likely favour gold, although this currently appears very unlikely.
Equities: Midterms to the rescue
On the eve of November US midterms and another potentially divisive election, the implications for the economy and assets are once again a focus in the media.
Investors facing large losses from negative returns in all major asset classes this year would do well to pay attention: historically, midterms have been good to equities.
Midterms are a de-facto ‘referendum’ on the sitting administration’s performance. It has been customary for the incumbent to lose ground, frequently resulting in decision-making gridlock. The consequence of this has been a perceived reduction in macro uncertainty and legislative risk, and therefore a boost for equities. As consistently as they have been punished on average in the year leading up to midterms, equities have benefited afterwards, posting positive returns over the subsequent six months on every occasion since 1970 (Chart 2). Gold’s performance following midterms has been more mixed. It has risen 62% of the time with a median return of 2% six months later.
Investor indifference
Yet despite close to a record voter turnout and plenty of media coverage, investors seem relatively disinterested in election politics (Chart 3).
Polling suggests an equity-friendly outcome is all but guaranteed, which may explain the sanguine investor stance.
Inflation and the Fed’s response is arguably a much more pressing topic given the fastest and strongest hiking cycle in modern history. Prior to the 2018 midterms, trade wars were more of a concern for markets – clearly a politically driven theme.
Chart 2: Midterms have been very kind to equities and benefited gold too
Midterms have been very kind to equities and benefited gold too
Performance of equities and gold from November election date, six months later
Midterms have been very kind to equities and benefited gold too
Performance of equities and gold over a six month period from November election date
Returns relative to the midterm date, using weekly Tuesday-end data. Midterms fall on Tuesdays. US equities based on MSCI US TR index, LBMA gold price PM
Source: Bloomberg, World Gold Council
Sources:
Bloomberg,
World Gold Council; Disclaimer
Returns are relative to the midterm date, using weekly Tuesday to Tuesday data as midterms always fall on a Tuesday. 6m = 26 weeks
Different this time?
Poor y-t-d performance and extremely weak sentiment suggests that little kindling would be needed to fuel a more prolonged bear-market rally in equities.
For gold, some might think a risk-on rally is a recipe for it to fall. But long-term correlations with equities are mildly positive. It’s only when equities see sharp selloffs that the correlation often becomes negative . So, an equity rally is no hindrance to gold doing well, as has been the case following midterms.
As polling stands, gridlock appears the most probable outcome, with a Republican sweep second most likely, given how close the race is for the Senate. The least likely outcome is for the Democrats to take both legislative bodies.
Chart 3: Media is all over the election, but the public and investors seem less interested
Media is all over the election, but the public and investors seem less interested
Google search interest and Fed funds rate
Google search interest and Fed funds rate
Media is all over the election, but the public and investors seem less interested
Google search interest and Fed funds rate
Source: Bloomberg, World Gold Council
Sources:
Bloomberg,
trends.google.com,
World Gold Council; Disclaimer
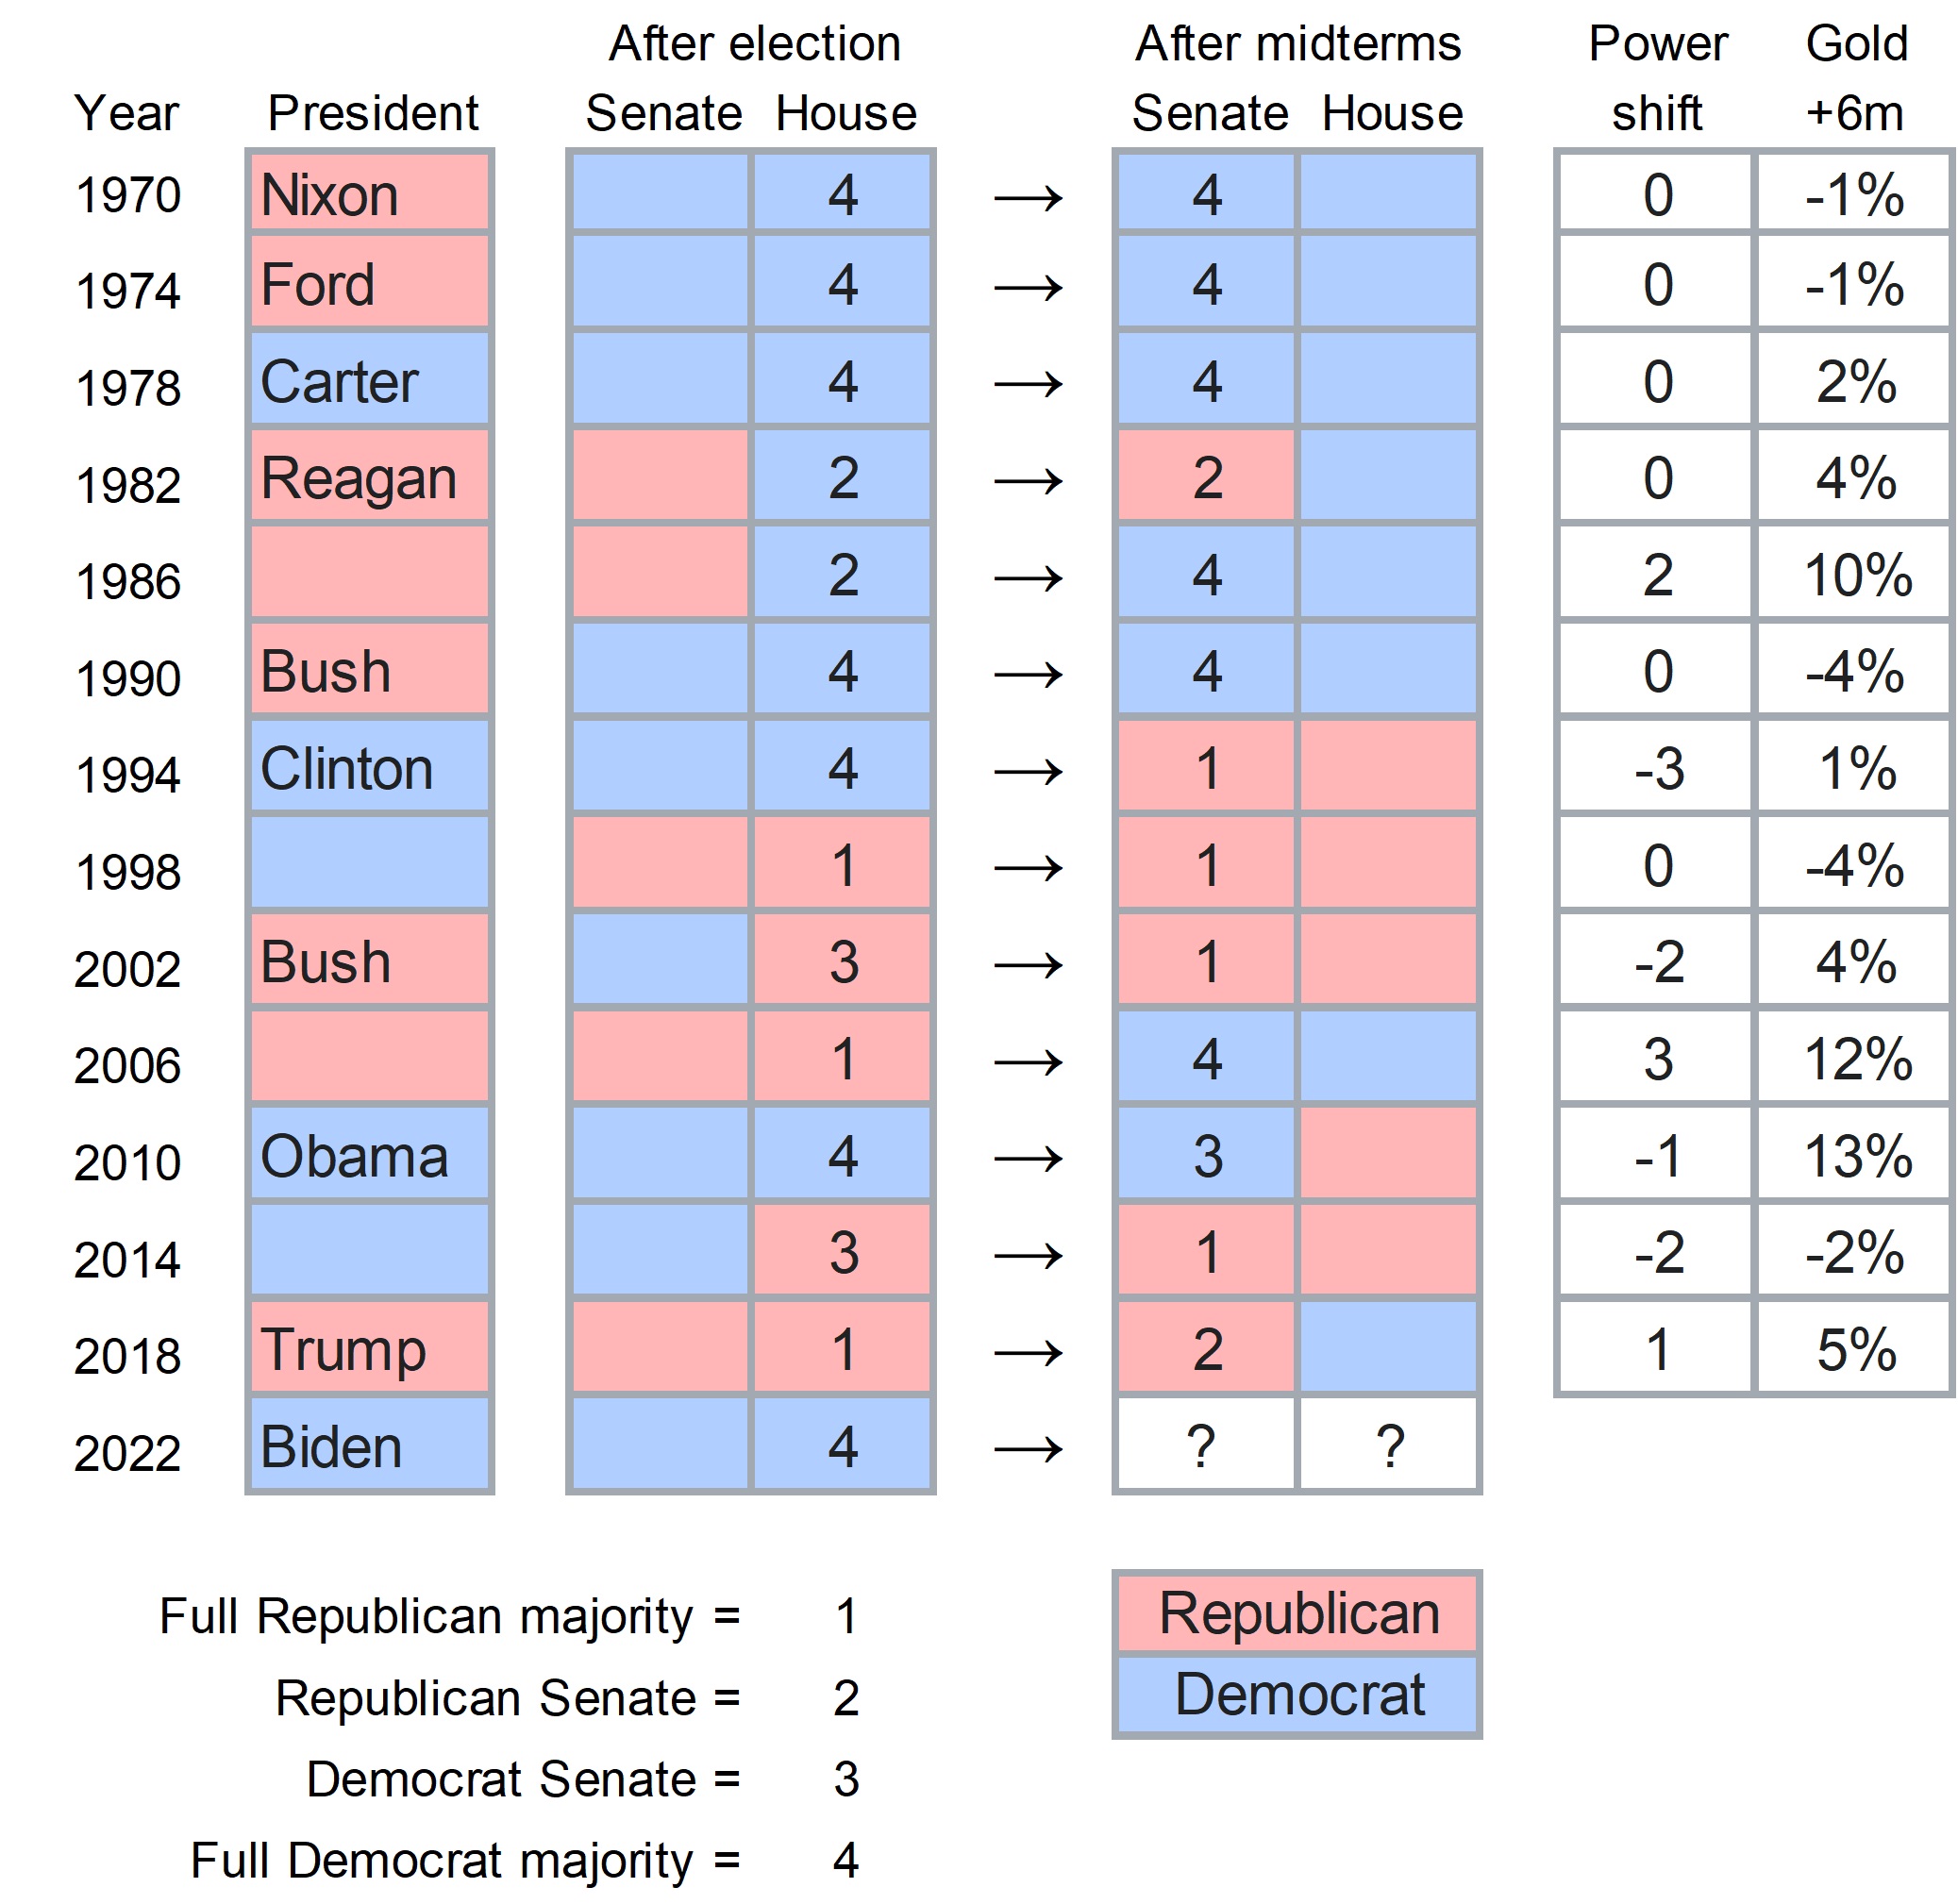
We looked back at gold’s response to each outcome. The sample size of midterms is small, so we treat findings with caution (Figure 1).
To determine the effect of election outcomes on gold, we classified four categories for Congress control: (1) for full Republican control, (2) for Republican Senate control, (3) for Democrat Senate control, and (4) for full Democrat control. We then regressed subsequent six-month gold returns on the changes in Congress control.
The effect, taken with a pinch of salt, is that results seem to matter for gold (Chart 4). But once we control for movements in the US dollar index (DXY), the effect is much less pronounced. So, gold needs the dollar to give it a helping hand. And we believe, as we outlined in last month’s commentary, that dollar headwinds are stacking up.
The most likely outcome – a House win for the Republicans with Democrats retaining the Senate – would replicate President Obama’s first term in 2010. That turned out rather well for gold, returning 13% after six months. The other probable scenario – a Republican sweep – less so. Such an event occurred only once, under Clinton’s first term in 1994, after which gold clung onto a 1% gain after six months. But a gridlocked Congress which occurred on three occasions, saw gold return 4%, 13% and 5% respectively.
US midterm elections, control shifts in Congress and gold’s subsequent six-month returns
Numbers illustrate control in the two legislative bodies with 1 being the most Republican and 4 the most Democratic
Source: Bloomberg, World Gold Council
Chart 4: Gold’s performance after midterm power shifts only convincing if US dollar rally softens
Congress control change and gold’s 6m forward return
Gold’s performance after midterm power shifts only convincing if US dollar rally softens
Gold’s performance after midterm power shifts only convincing if US dollar rally softens
Congress control change and gold’s 6m forward return
Source: Bloomberg, World Gold Council
Sources:
Bloomberg,
World Gold Council; Disclaimer
Conclusion
In summary, the midterms appear to have a more consistent and positive impact on equities than on gold. They can present both opportunities and challenges but there is little historical evidence to suggest a material impact. The most favourable gold scenario would likely be a surprise Democratic sweep, which looks improbable. We maintain therefore that monetary policy and the trajectory of the US dollar will be far more key for gold over the next few months.
We also see support for gold from some central banks dialling back aggressive policy including the Reserve Bank of Australia (RBA) and Bank of Canada (BOC), and from interventions in markets from the likes of the Bank of Japan (BOJ), People’s Bank of China (PBoC), Reserve Bank of India (RBI) and the Bank of England (BOE).
And sentiment in gold may improve from slowing ETF outflows, high retail demand, and short-covering risk in COMEX net longs.
Regional insights
China: A decline in the average daily trading volumes of Au9999 exhibited seasonal patterns. Turning to the retail side, the seven-day National Day Holiday, a stable local gold price, weak RMB and economic uncertainty supported gold sales in regions such as Beijing and Shanghai.2 The elevated Shanghai-London gold price spread in October reflected upbeat sentiment and optimistic expectations. However, the on-and-off COVID-19 resurgence spelled bad news for gold sales in some areas.
India: October retail demand remained strong due to onset of festivals and weddings. Dussehra and Dhanteras festivals sparked fresh physical demand during the end of the month. With the festival of Dhanteras celebrated on two days this year (22 and 23 October) and stable gold price, both jewellery (weddings and normal) and bar and coin purchases were boosted. With demand strong, the local market jumped into a premium of US$3/oz by end of October; higher than the small discount of US$0.5-1/oz seen at the end of September.
Europe: The ECB’s hiked 75bps again.3 It was too late to prevent Euro-area inflation hitting a record high of 10.7%. Hot on the heels of Germany’s 46% y-o-y rise in PPI, this could ensure continued strength in regional gold bar and coin demand. Political upheaval and economic policy backtracking in the UK coincided with CPI breaching 10% for the first time ever and a 50-year low in consumer confidence. In response, the BOE increased its target rate by 75 bps as well, following in the footsteps of other central banks.4
US: Combined US Mint gold Eagle and Buffalo coin sales totalled 89,500oz in October (-5% m-o-m, -54% y-o-y), y-t-d gold sales by the US Mint now total 1,267,500oz, 1% lower than last year.
Central banks: Reported global official gold reserves rose by 30t in September according to available data. Turkey was once again the largest buyer, adding another 11t during the month. Uzbekistan (9t), Kazakhstan (7t) and India were the other notable buyers in October. More generally, our latest Gold Demand Trends report summarizes central bank activity during Q3.
ETFs: Global gold ETF holdings saw their sixth consecutive monthly declines in October, standing at 3,490t (US$184bn) at the end of the month. The 59t (US$3bn) loss during the month tipped the y-t-d gold ETFs’ performance to net outflows, now down 52t (US$785mn) on the year. North American funds led global outflows, likely driven by rising yields and a strong dollar. Funds listed in the UK drove outflows in Europe as political and economic turmoil clouded market sentiment. Meanwhile, funds in the “other” region remained stable in October.5, 6
Table 2: North American ETFs led outflows in October
Gold ETF holdings and flows by region*
*Data to 31 October 2022. On Goldhub, see: Gold-backed ETF flows.
Source: Bloomberg, Company Filings, ICE Benchmark Administration, World Gold Council
Footnotes
Based on the LBMA Gold Price PM in USD as of 31 October 2022.
China Gold News, 22 October 2022 (in Chinese).
Financial Times, ECB raises rates by 75 basis points as markets detect ‘dovish pivot’, 27 October 2022.
Financial Times, Bank of England raises interest rates by 0.75 percentage points, 3 November 2022.
All value figures based on the LBMA Gold Price PM as of 31 October 2022.
We regularly review the global gold-backed ETF universe and adjust the list of funds and holdings based on newly available data and information.