The gold deposit rate is the interest rate that a central bank earns from lending out its gold. The gold lease rate is the interest rate that a borrower pays to borrow gold. There is a spread between the gold deposit rate and the gold lease rate.
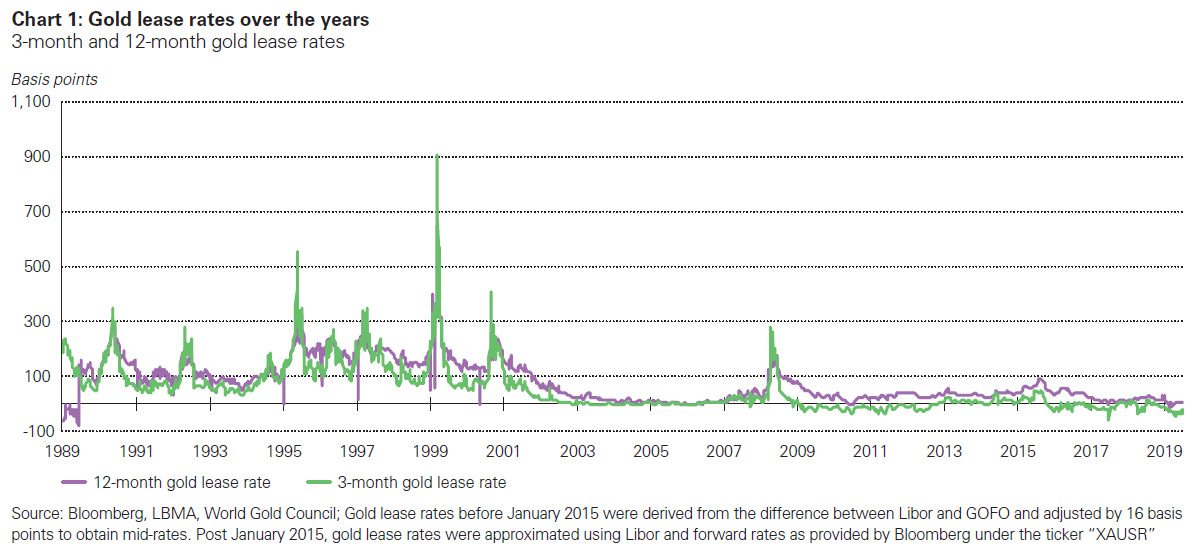
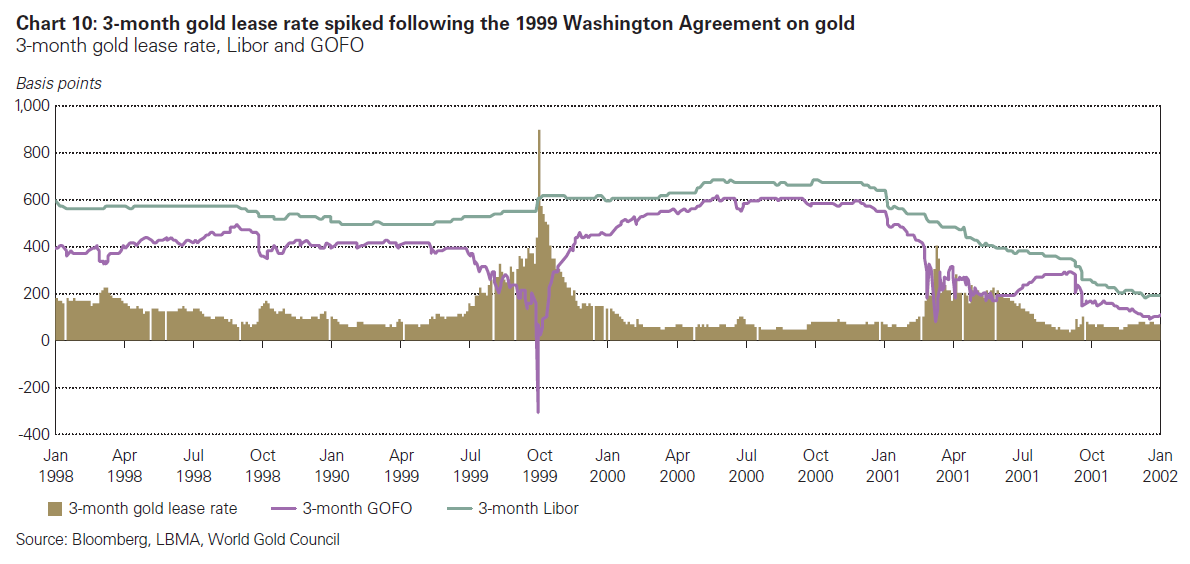
In this paper, gold lease rate refers to the gold lease mid-rate. The gold lease mid-rate is adjusted by 16 basis points from the difference between Libor and GOFO. 3 Both 3-month and 12-month gold lease rates are found to possess random walk characteristics with significant correlation to their 1-period lags.
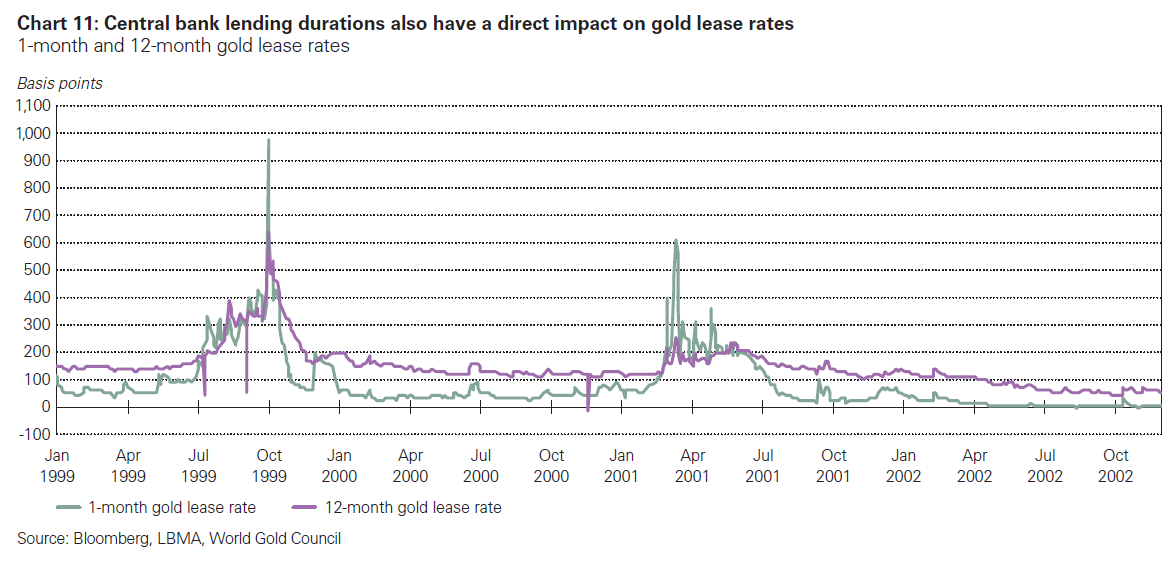
Both 3-month and 12-month gold lease rates are found to possess random walk characteristics with significant correlation to their 1-period lags.
We used a random forest regression model to examine the drivers of gold lease rates.
Prediction accuracy is based on the R2 of the test dataset that runs from 2017 to 2019.
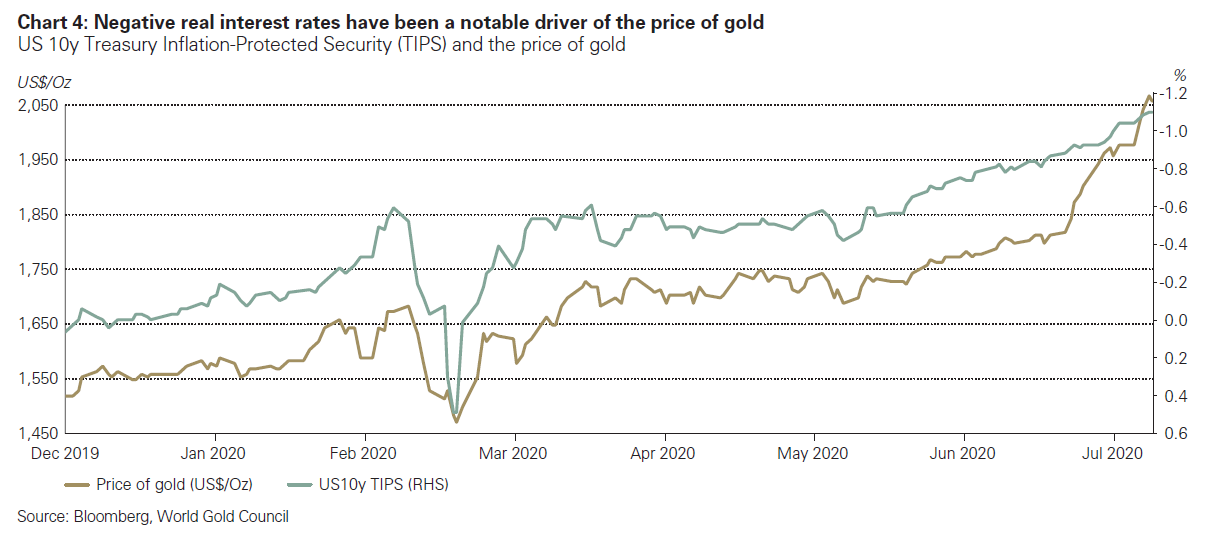
Real interest rates is represented by the US 10y Treasury Inflation-Protected Security (TIPS).
Equity market volatility is represented by the 90-day annualized volatility of the S&P 500.
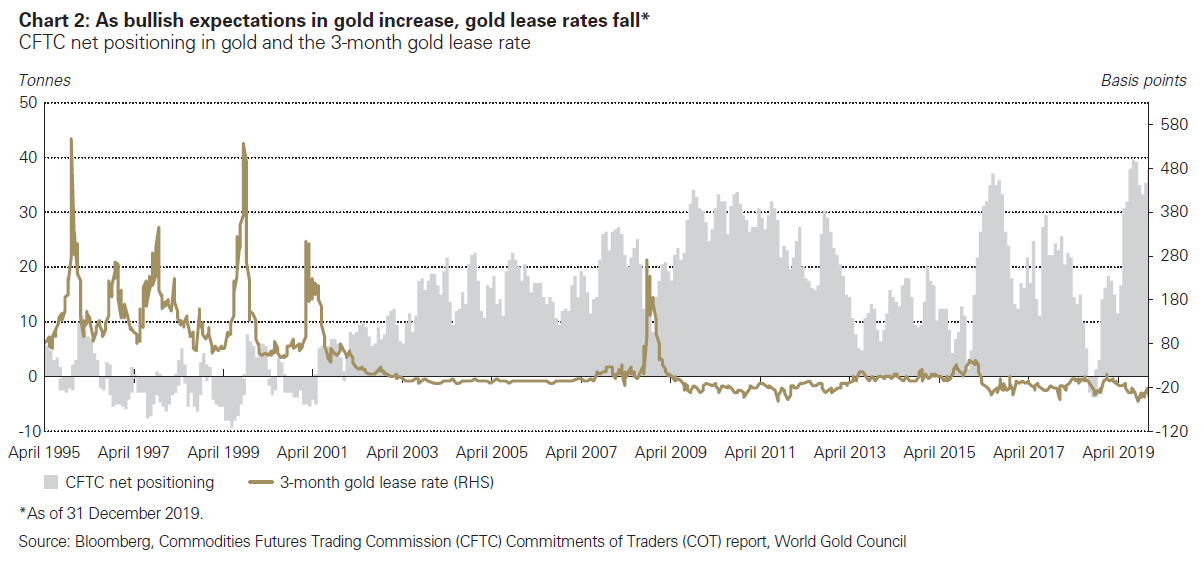
Speculative positioning in gold is represented by the open interest data from the Commodity Futures Trading Commission (CFTC) Commitment of Traders
IMF, World Gold Council. For more details, please visit the section on “Monthly central bank statistics” on www.Goldhub.com
Central banks are able to lend out allocated gold. Upon lending, the gold will however become unallocated. At the end of the term, a different set of gold bars will be returned as allocated.
As of June 2020, the current market-making members of the LBMA are BNP Paribas, Citibank NA, Goldman Sachs International, HSBC, ICBC Standard Bank Plc, JP Morgan Chase Bank and Merrill Lynch International.
London Bullion Market Association (2008). A Guide to the London Precious Metals Market, page 21.
London interbank offered rate (LIBOR) is the average rate representative of the rates at which large global banks are able to charge each other for short-term, unsecured loans.
Arbitrage opportunities will exist if this relationship is not maintained.
Izabella Kaminska (2013, March 9). “On Stabilising the Gold Price.” Financial Times, retrieved from https://ftalphaville.ft.com/2013/03/08/1079561/on-stabilising-the-gold-price/
In Barone-Adesi, Giovanni / Geman, Helyette / Theal, John (2009) “On the Lease Rate, the Convenience Yield and Speculative Effects in the Gold Futures Market”, the authors computed the potential profits of the gold carry trade for the 1M, 3M, 6M and 12M contracts over 1996 – 2009. They found that while 1M contracts saw the best profits from the gold carry trade relative to longer duration contracts, all contracts saw a loss in potential profits post-2000, with the 12M carry trade seen not profitable at all from 2001 until 2009.
In his investigation of gold lease rates between 1995 and 1999, Ted Reeve, a commodity analyst at Scotia McLeod, attributed the spike in gold lease rates in November 1995 to the lack of gold available for lending amidst short speculative pressure. See also Bohm, Christian, (2010, June 18), “The Gold Lending Market”, page 15.
Barisheff, Nick. (2013) “$10,000 Gold: Why gold’s inevitable rise is in the investor’s safe haven” (1st edition). Wiley.
GFMS survey, World Gold Council.
Based on the intraday high of London spot market prices on 6 September 2011.
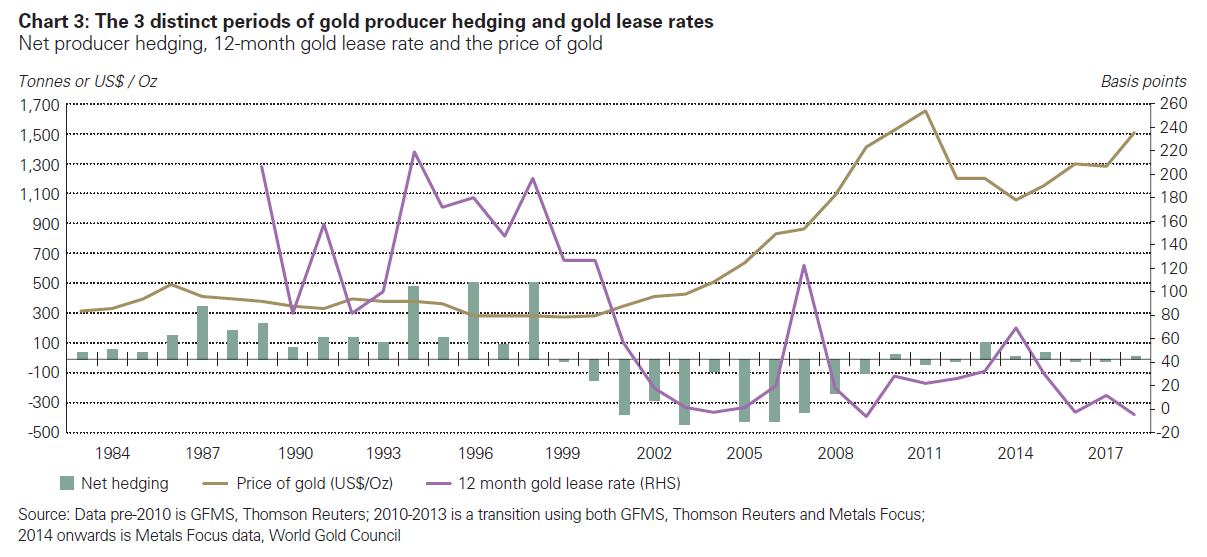
Levin and Wright (2006) found that gold prices are negatively correlated to gold lease rates. See: Levin, E.J. and Montagnoli, A. and Wright, R.E. (2006) “Short-run and long-run determinants of the price of gold” and O’Connor, Lucey, Batten and Baur (2015) “The Financial Economics of Gold – A Survey”.
Levin, Eric & Abhyankar, Abhay & Ghosh, Dipak (1994). “Does the Gold Market Reveal Real Interest Rates?”, The Manchester School of Economic & Social Studies, University of Manchester, vol. 62(0), pages 93-103.
London Bullion Market Association, (2017), “The Guide – An Introduction to the Global Precious Metals OTC Market”, page 45.
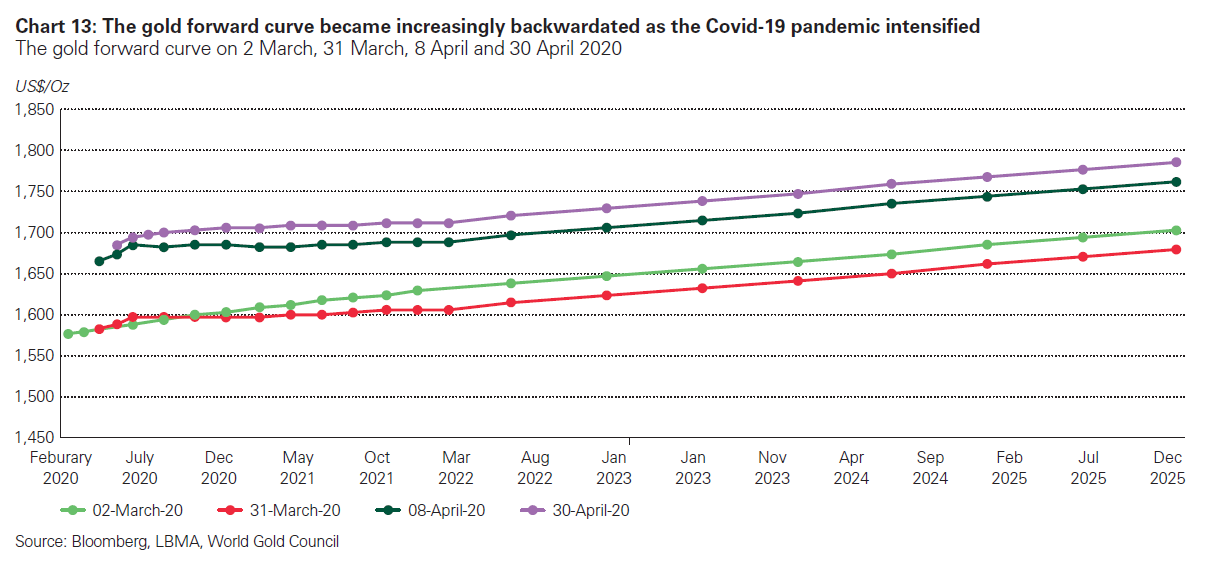
For more details, see section on “The Convenience Yield.” Also see Kaminska, Izabella (2020, August 20). “What’s with gold backwardation?” Financial Times, retrieved from https://ftalphaville.ft.com/2020/08/05/1596631139000/What-s-with-gold-backwardation-/
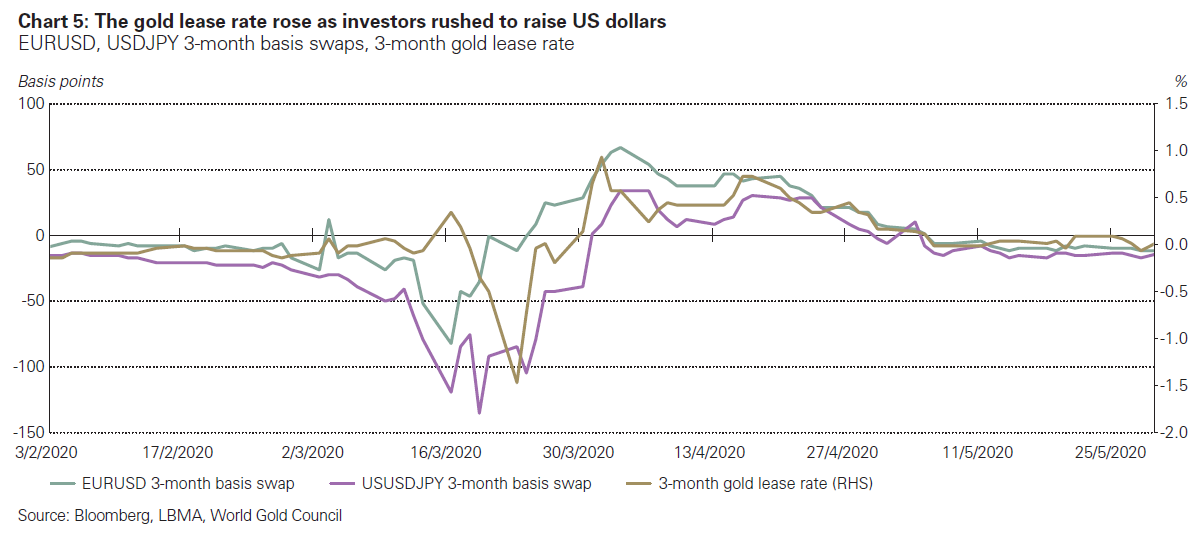
Kondo, Masaki and Xie, Ye (2020, March). “How the Fed’s swap lines aim at dollar funding stress”. Bloomberg, retrieved from www.bloomberg.com/news/articles/2020-03-17/how-cross-currency-basis-swaps-show-funding-stress-quicktake?sref=sbXp5zJX
Gillian Tett, Paul J. Davies and Norma Cohen (2007, August 13), “Structured investment vehicles’ role in crisis” Financial Times, retrieved from www.ft.com/content/8eebf016-48fd-11dc-b326-0000779fd2ac
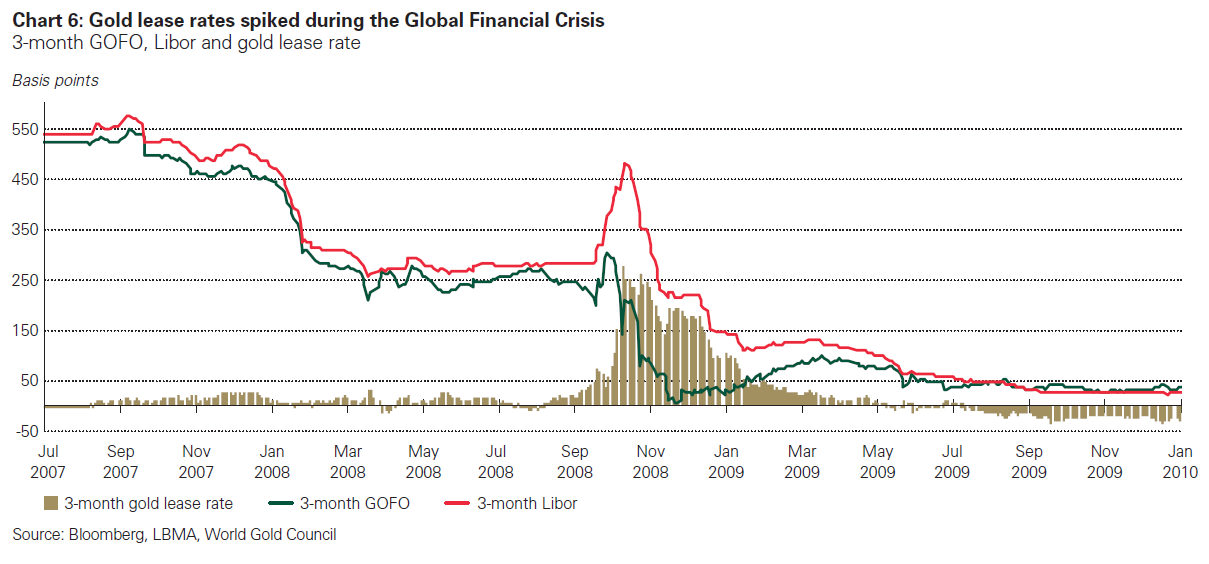
David Barclays and Christophe Duval-Kieffer in LBMA Alchemist issue 54 explained in greater detail the drivers behind the movements in GOFO and Libor during the financial crisis. Broadly, the authors compared both Libor and GOFO to the overnight indexed swap (OIS) and studied the inherent risk involved in the different funding rates.
Central banks have experienced defaults in their gold loans before. When Drexel Burnham Lambert financial services group, a frequent gold borrower, collapsed in February 1990, several central banks suffered losses on their gold loans.
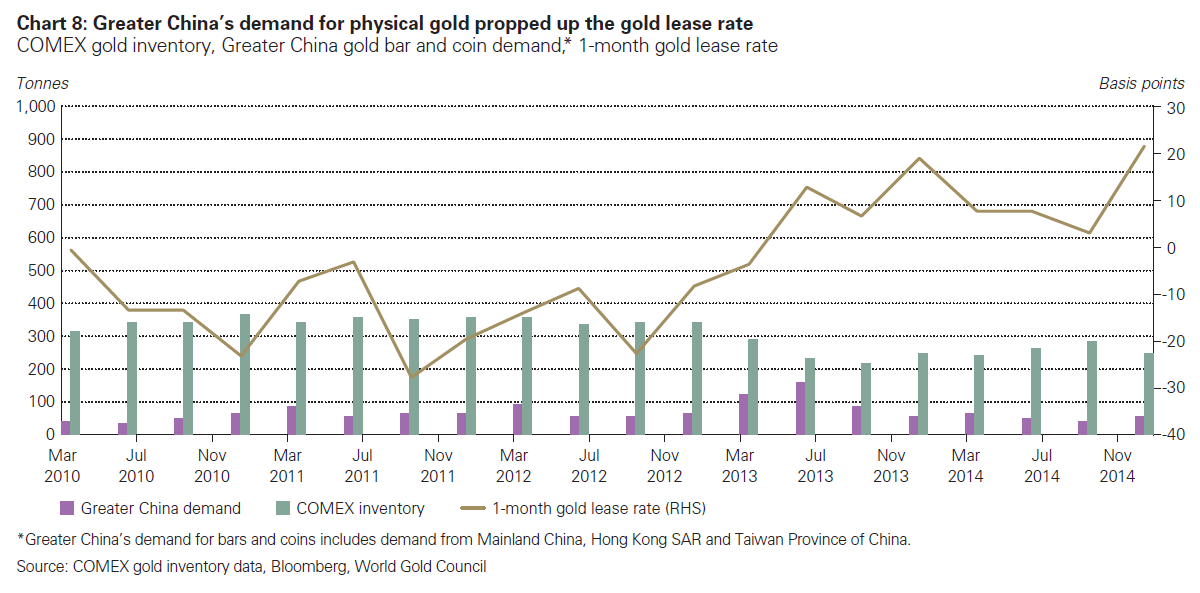
World Gold Council, Gold Demand Trends.
World Gold Council, Local gold price premium / discount.
In their paper “On the Lease Rate, the Convenience Yield and Speculative Effects in the Gold Futures Market”, authors Barone-Adesi, Geman and Theal found that gold bullion inventories held by COMEX market-making members are negatively related to gold lease rates. Specifically, they found that bullion leases of 1-month duration have a strong impact on inventory levels due to lease repayments in bullion that would cause inventory levels to fall.
Tang, Frank. (2013, July 10). “Gold borrowing rates hit 2009 highs as sell-off tightens supply”, Reuters, retrieved from www.bibme.org/citation-guide/apa/newspaper/
Shimko, David C. / McDonald, Robert L. (1997): “A golden opportunity?” Risk Magazine, Vol. 10, 37; see also Bohm, Christian, (2010, June 18) “The Gold Lending Market” page 15.
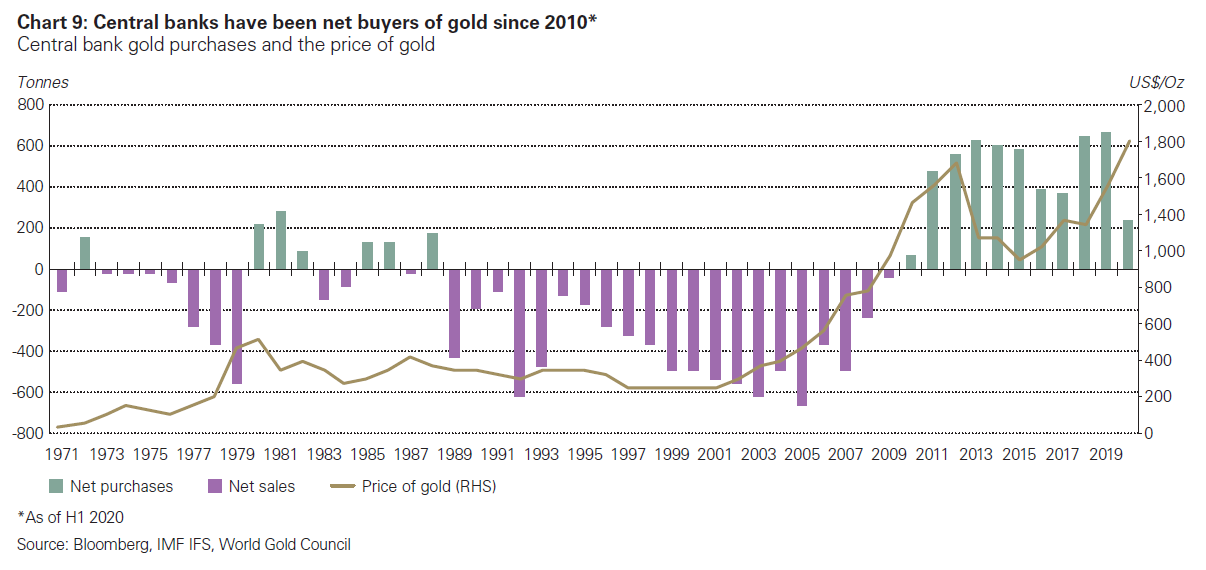
World Gold Council, May 2020, 2020 Central Bank Gold Reserve Survey.
Marr-Johnson, Merlin. “The Effects of Lease Rates on Precious Metal Markets” London Bullion Market Association Alchemist Issue 29 page 20.
ibid 16.
Farchy J, Vasquez J. (2020, March 24) “Gold Market Snarled by Virus Lockdown as World Races for Haven” Bloomberg, retrieved from www.bloomberg.com/news/articles/2020-03-24/scramble-for-gold-sends-new-york-premium-to-a-four-decade-high?sref=sbXp5zJX
Excluding the 1-period lag of gold lease rates.