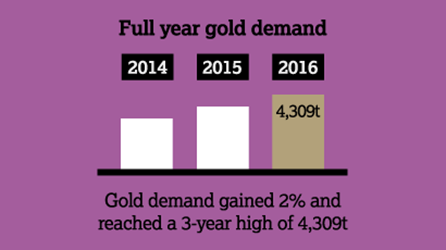
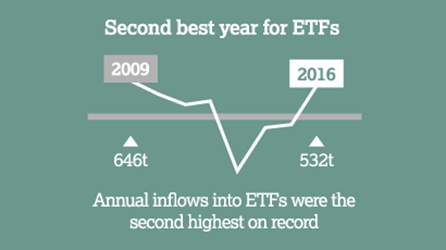
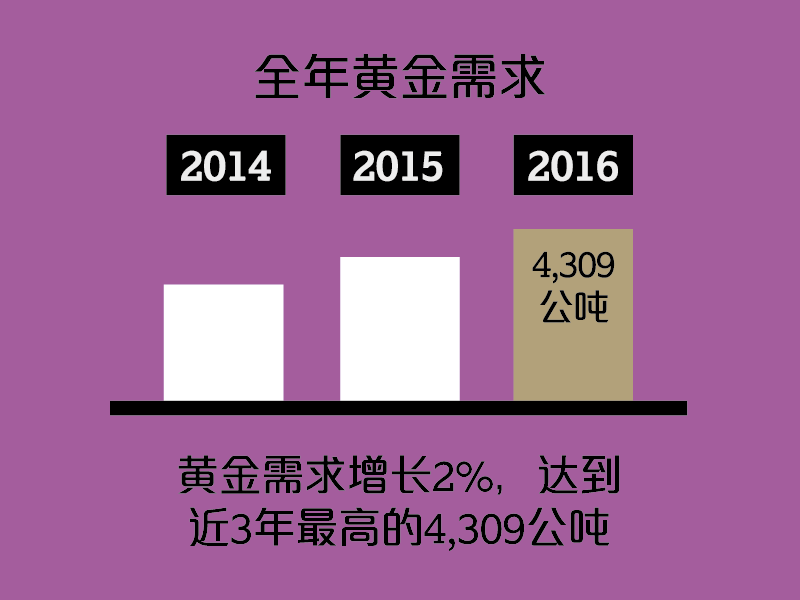
2016 full-year gold demand gained 2% to reach a 3-year high of 4,308.7t. Annual inflows into ETFs reached 531.9t, the second highest on record. Declines in jewellery and central bank purchases offset this growth. Annual bar and coin demand was broadly stable at 1,029.2t, helped by a Q4 surge.

Highlights
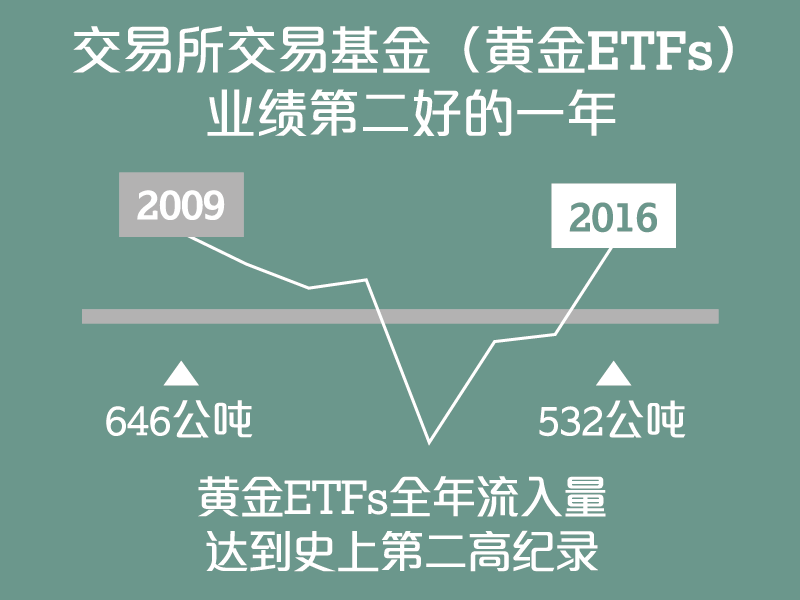
2016 was the second best year for ETFs on record. Global demand for gold-backed ETFs and similar products (ETFs) was 531.9t - the highest since 2009. Q4 saw outflows.
Bar and coin demand sprang into life in Q4. Having been subdued for most of the year, the price fall in Q4 was the buying opportunity many retail investors had been waiting for. Q4 was China’s strongest quarter for bar and coin demand since Q2 2013.
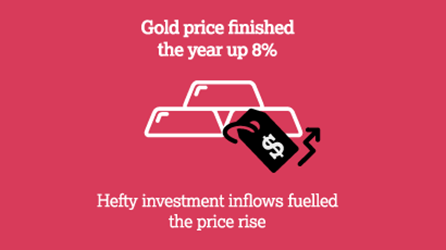
The gold price ended the year up 8%. Having risen 25% by the end of September, gold relinquished some of its gains in Q4 following Trump’s conciliatory acceptance speech and the FOMC’s interest rate rise.
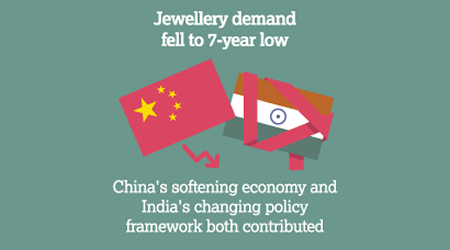
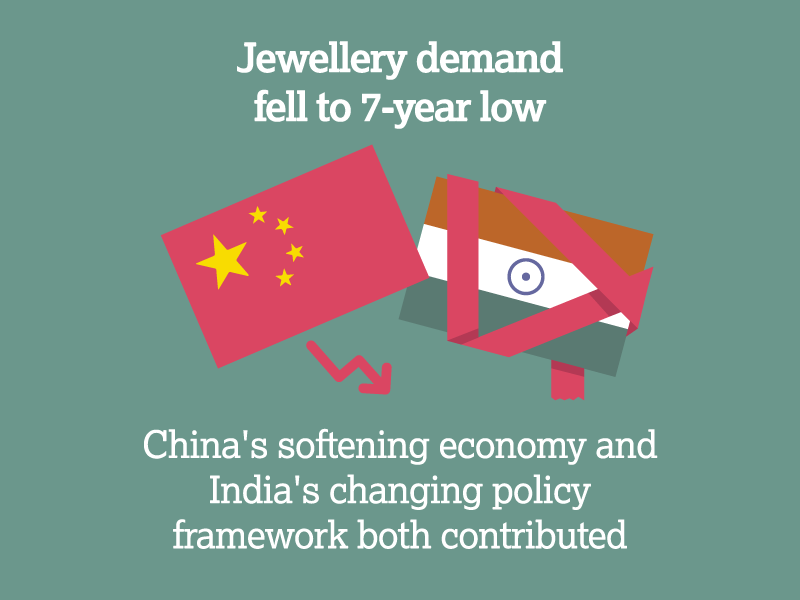
2016 saw a 7-year low for jewellery demand. Rising prices for much of the year, regulatory and fiscal hurdles in India and China’s softening economy were key reasons for weakness in the sector.
India’s shock demonetisation policy brought the market to a virtual standstill. An initial rush for gold following the policy announcement came to a swift halt in the ensuing cash crunch.
Central bank demand was the lowest since 2010. Net purchases (383.6t) were 33% lower than 2015, due in part to increased pressure on FX reserves. Despite this, 2016 was the 7th consecutive year of net purchases by central banks.
Contributors
Louise Street, Krishan Gopaul, Mukesh Kumar, Carol Lu, Alistair Hewitt. Contact us: [email protected]
