India gold market update: Seasonal demand shows early strength
20 October, 2026
Highlights
- Gold prices have remained rangebound in October1 following the sharp decline in September; domestic market discounts have narrowed
- Seasonal demand is gathering pace, with the recent decline in prices providing further support
- Gold ETF net inflows reached a seven-month high in September and have remained positive through mid-October; temporary restrictions on subscriptions to gold mutual funds are likely to have a modest impact on flows
- Digital gold demand remained firm, with purchases rising 5% m/m to 1.7t in September. Gold futures trading in September eased modestly from August’s five month high, while gold imports dropped sharply
- Listed jewellers posted healthy growth in the July to September quarter.
Looking ahead
- The festive and wedding season provides a favorable near-term demand backdrop, with lower prices supporting jewellery spend although elevated price levels may continue to limit volume growth.
Gold steadies in October
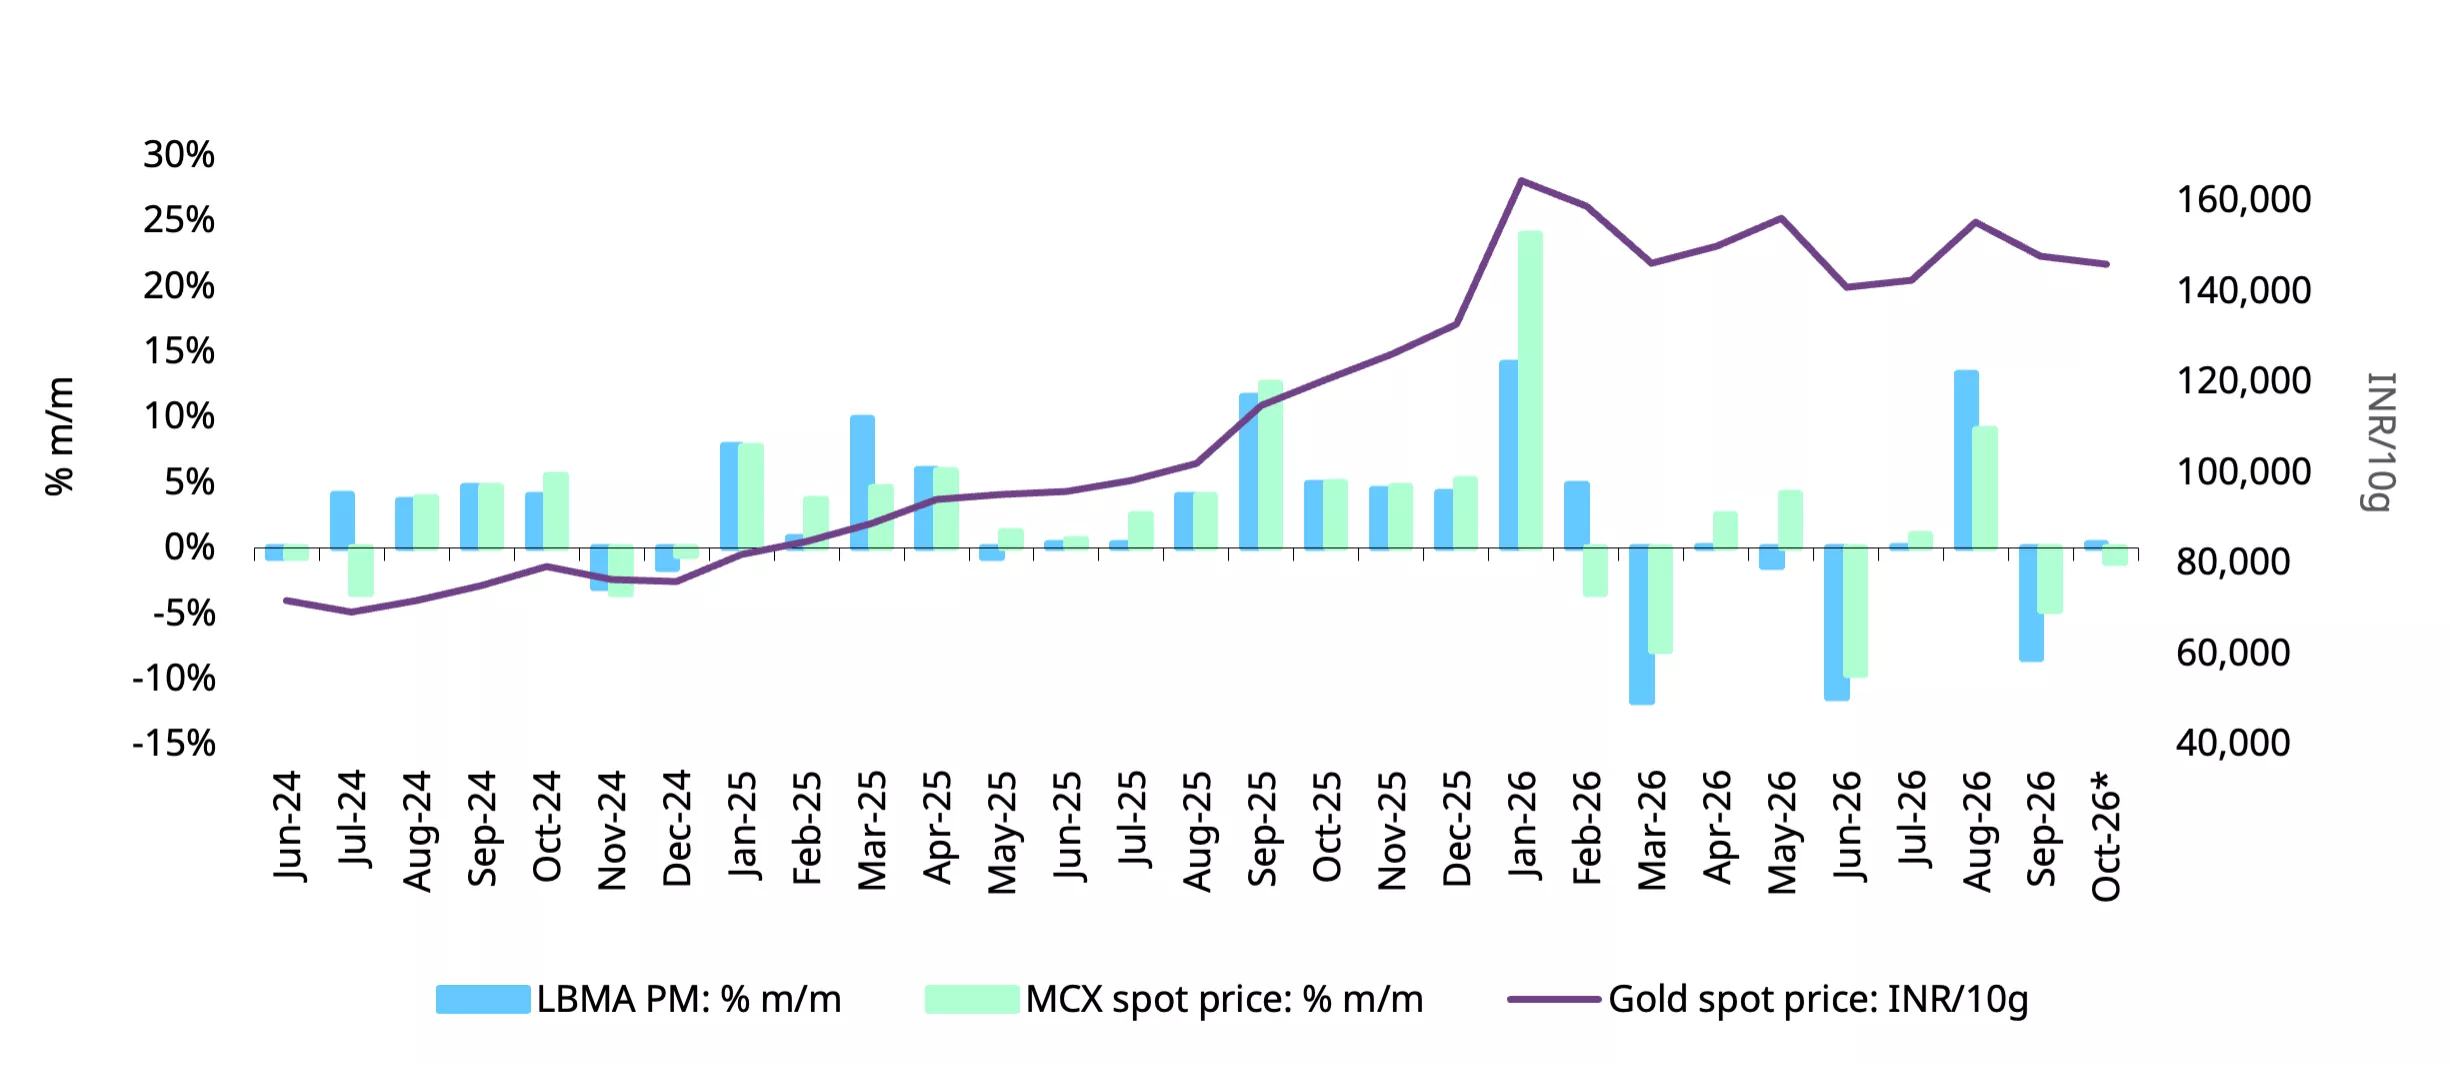
Gold prices retreated in September, ending the month at US$4,176/oz,2 down 8.5% m/m as higher US Treasury yields, a stronger dollar and reduced futures positioning weighed on prices, despite strength in global ETF inflows. Domestic prices3 fell by a more modest 4.8% to INR147,613/10g, with weakness in the INR cushioning some of the decline in international prices. Prices have remained rangebound in October. At mid-month, international gold prices were broadly stable from end-September, while domestic prices were around 1% lower, partly due to gains in the INR.
Chart 1: Gold stabilises after sharp pullback
Month-end LBMA Gold Price PM and MCX spot gold price changes and movement*
*As of 16 October 2026. Source: Bloomberg, World Gold Council
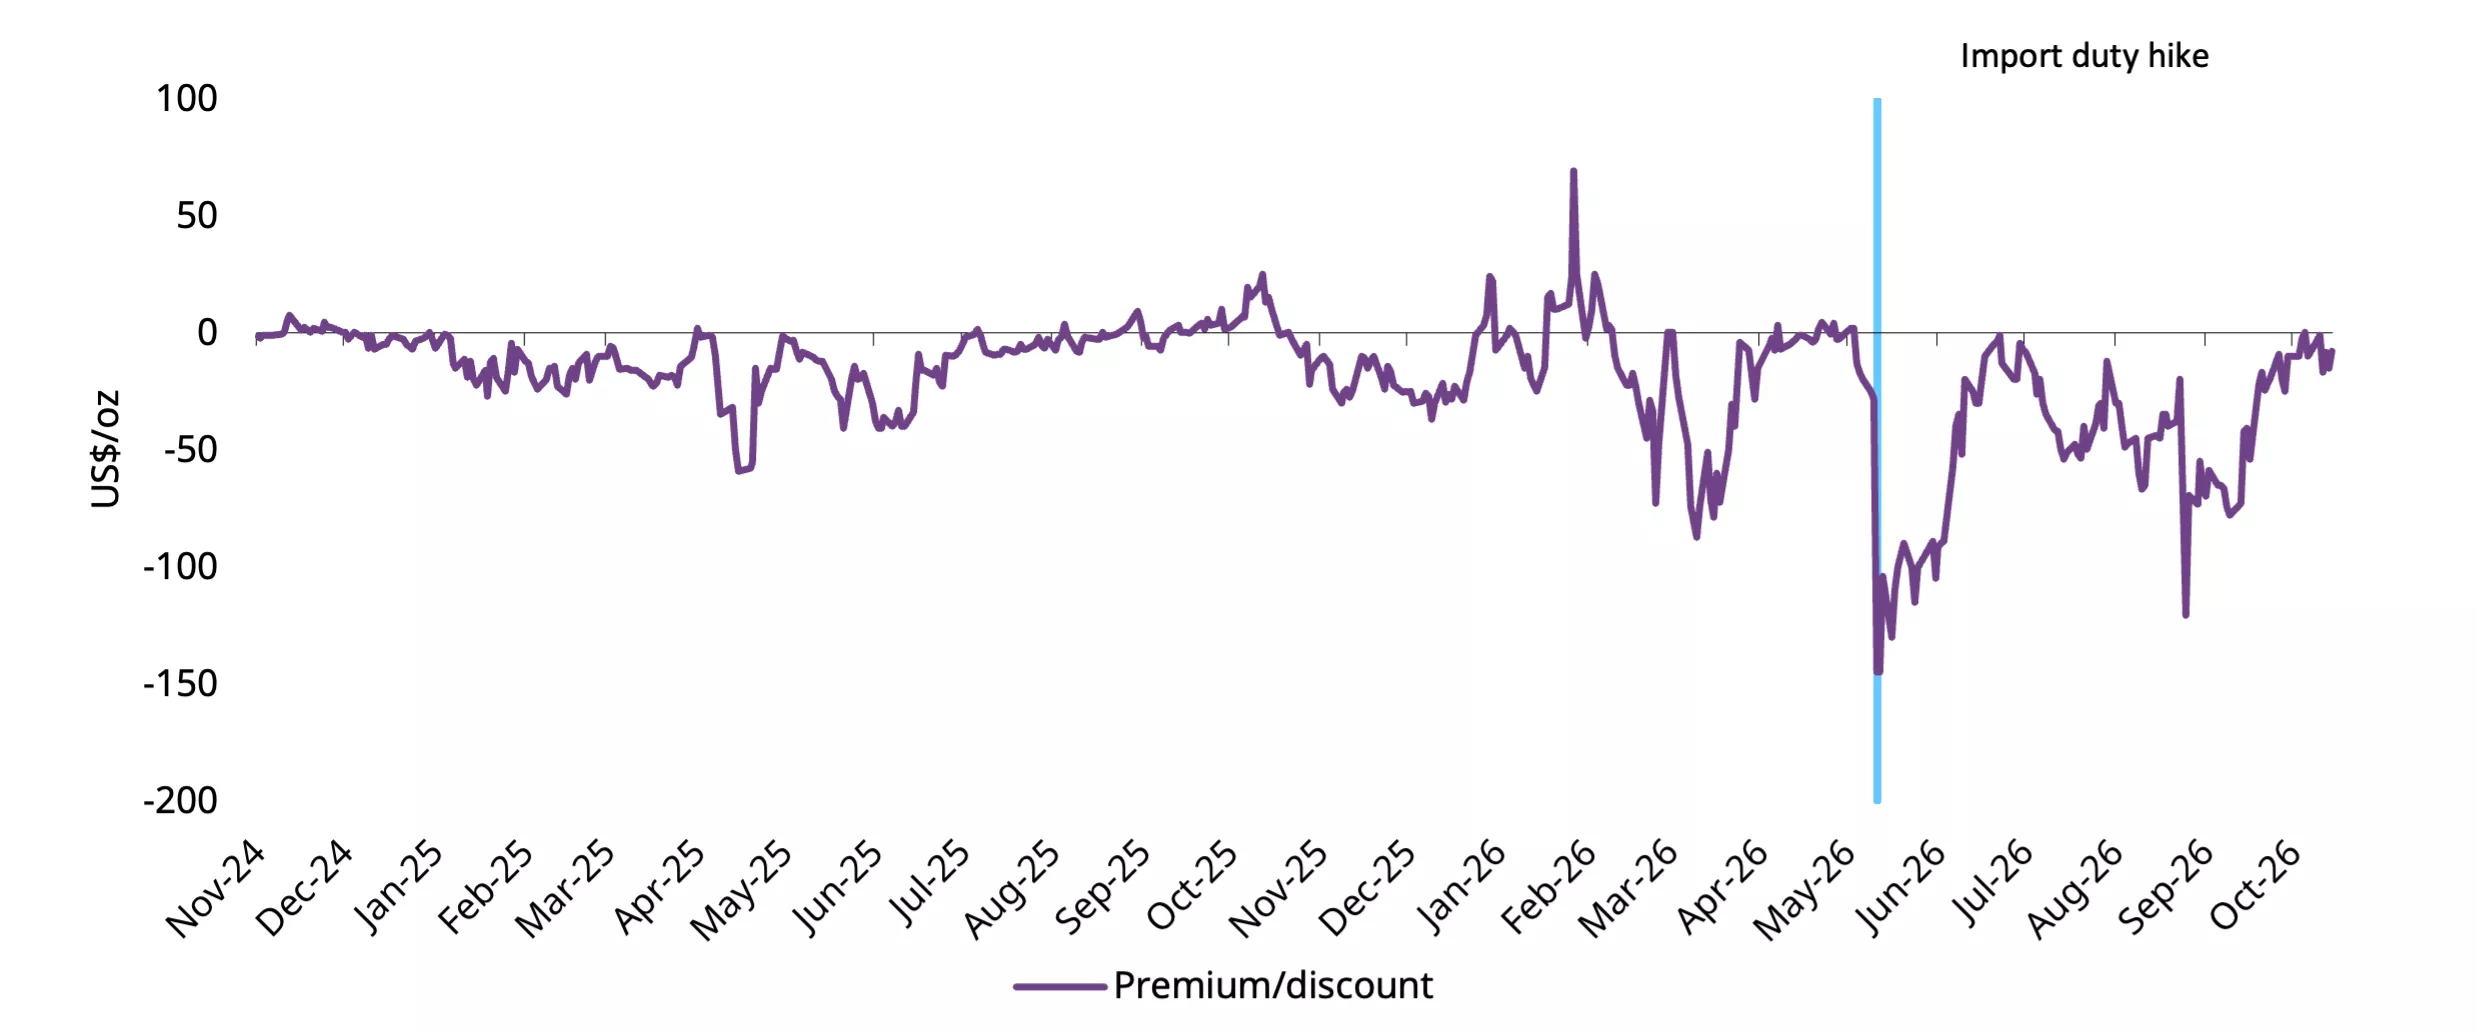
Domestic gold price discounts have narrowed sharply in October, from an average of US$66/oz in September to US$8/oz as of 16 October. The narrowing reflects improving seasonal demand, although the continued discount to import parity indicates adequate domestic supply, with industry feedback citing old-gold supply and unofficial inflows as contributing factors.
Chart 2: Domestic price discounts narrow
NCDEX gold premium/discount relative to the official domestic price*
*As of 16 October 2026.
Source: NCDEX, World Gold Council
Seasonal demand gains traction
Seasonal gold demand is gaining traction as the market enters the key festive and wedding period. The recent decline in gold prices has provided some support to demand. Manufacturers are reporting healthy order flows as retailers replenish inventories to meet this seasonal demand, while industry feedback points to improving in-store footfall. Alongside increased marketing and promotional activity, jewellers have focused on fresh designs and lighter weight pieces, which offer greater wearability.
Old-gold exchange remains an important feature of the market, with jewellers offering additional incentives to encourage consumers to trade existing holdings for new purchases; this also contributes to domestic gold supply.
Bar and coin demand, meanwhile, has reportedly moderated as price momentum has eased, tempering some of the investment-related buying seen during the earlier price rally.
Strong revenue growth for listed jewellers
Listed jewellery retailers reported strong double-digit revenue growth in the range of 20-30% y/y in the Jul-Sep quarter,4 suggestive of resilient consumer demand despite elevated and volatile gold prices during the quarter and a less favourable festive calendar. The performance was particularly noteworthy as key festivals that supported sales in the same period last year shifted to the Oct-Dec quarter this year.
Growth was driven by a combination of strong same-store performance and continued network expansion. Retailers maintained an active pace of expansion, with the largest players adding 42 stores during the quarter. Same-store sales growth of around 20% suggests that growth was not only driven by the opening of new retail outlets but also by healthy demand across existing stores. Retailers are also focusing on tighter inventory control to help manage working capital pressure caused by the elevated gold price.
Demand during the quarter benefitted from wedding-related buying, festive purchases, growing consumer preference for lightweight jewellery, brand-led promotional activity and strong growth in e-commerce channels. The growth profile indicates that value growth continued to outpace volume growth. Buyer growth remained in the mid-single digits, while average ticket sizes increased by double digits, reflecting the combined impact of higher gold prices and ongoing premiumisation. Old-gold exchange transactions remained an important source of demand, rising by more than 10% y/y and accounting for over 50% of sales for some retailers.
In contrast, investment-led coin demand reportedly moderated from a strong base.
Management commentary is positive for the coming two quarters, supported by festive demand and the peak wedding season. Sales are expected to benefit from new store openings as well as marketing and promotional campaigns.
Positive inflows into gold ETFs
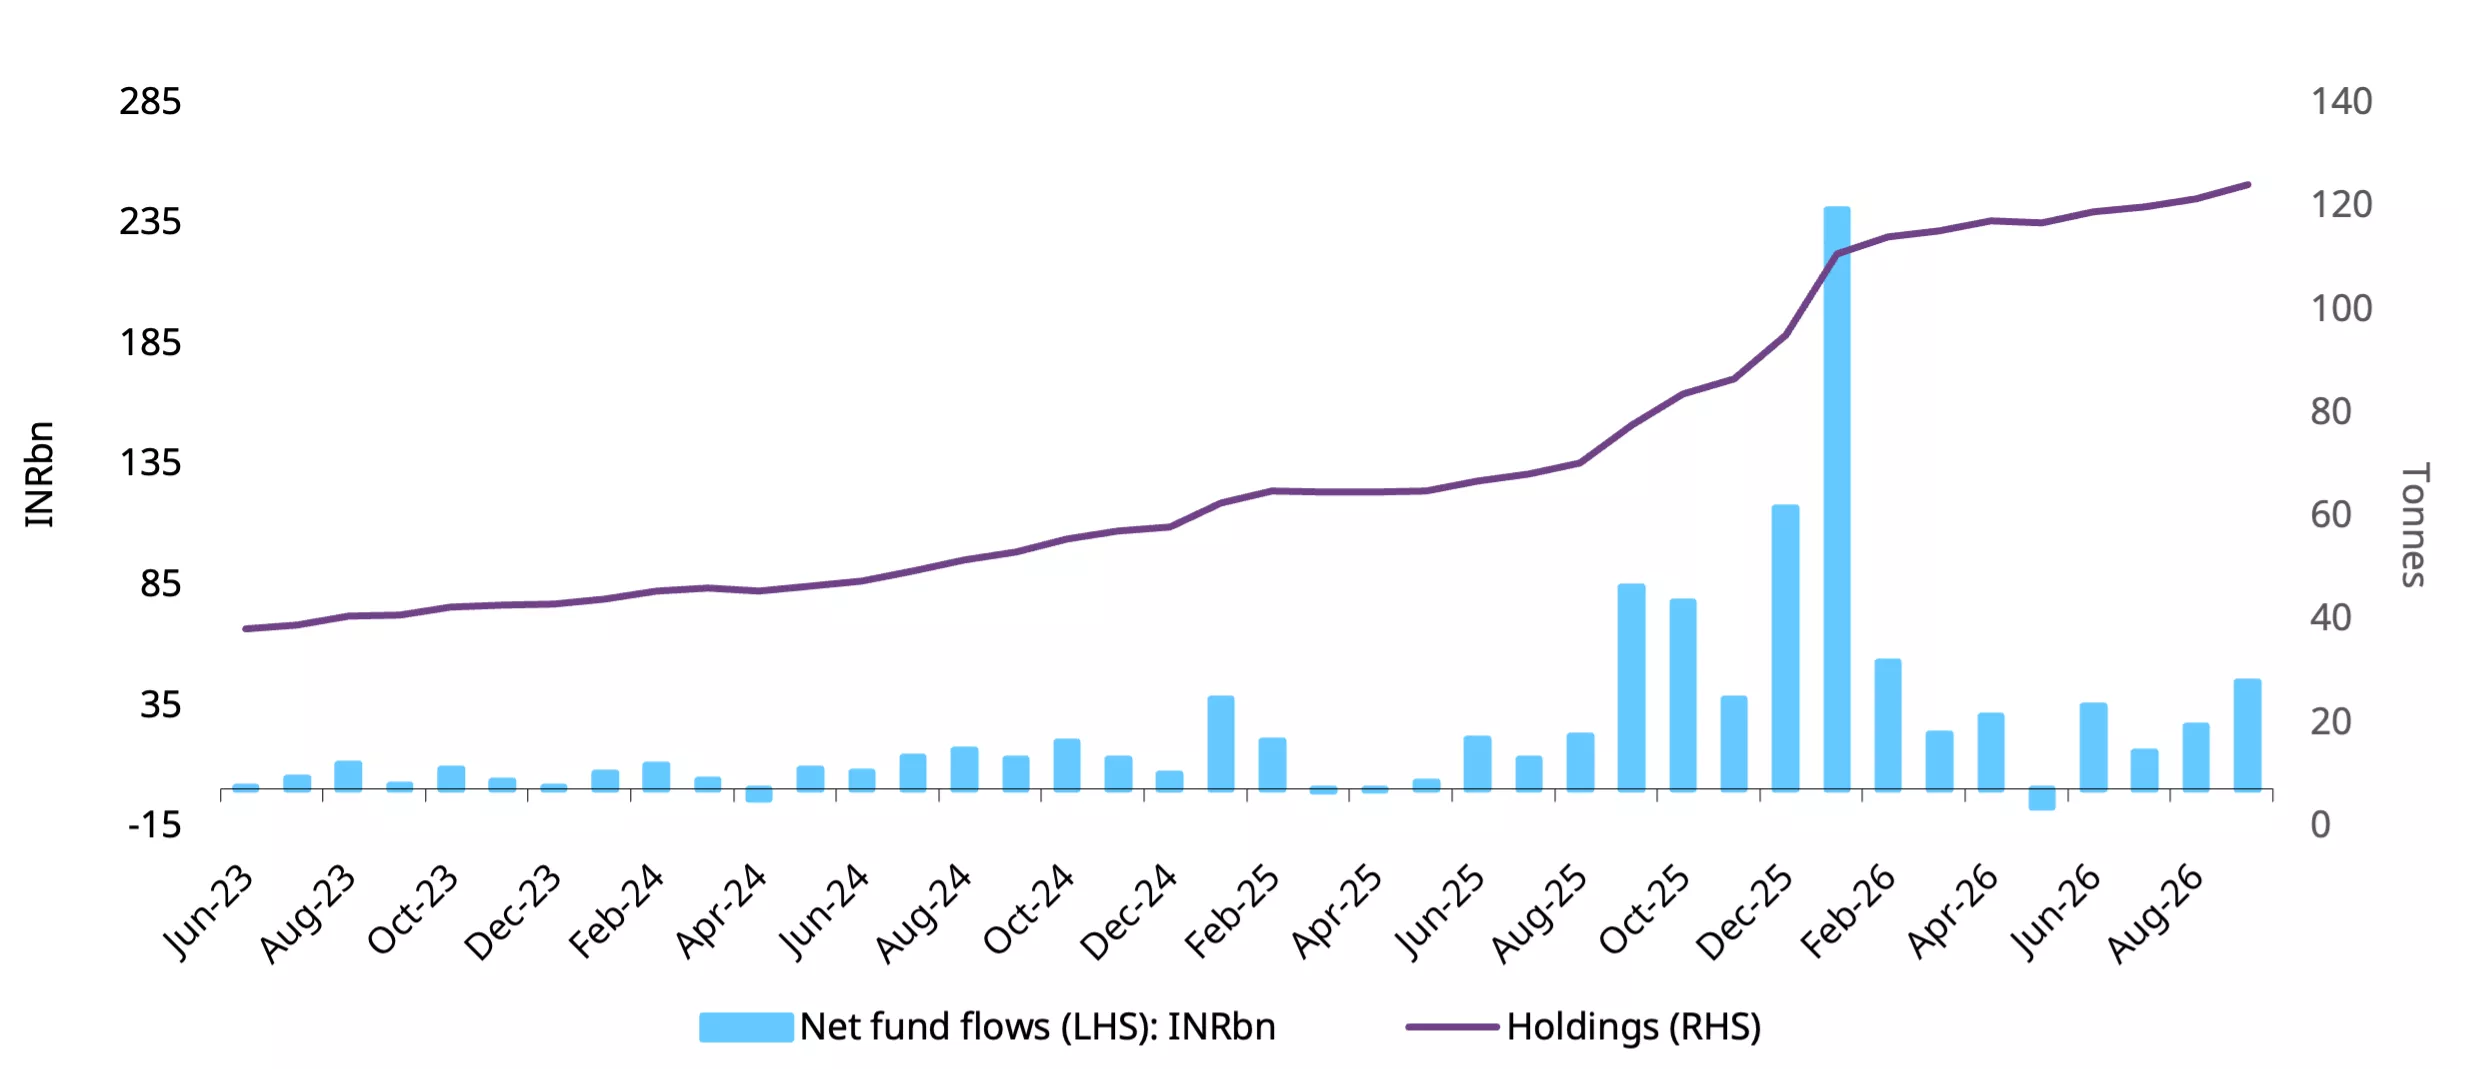
Indian gold ETFs saw stronger net inflows in September, broadly in line with the global trend. According to data from the Association of Mutual Funds in India (AMFI), net inflows rose to INR44.5bn (US$466.2mn), the highest in seven months. Nearly 3t was added to holdings during the month, taking cumulative holdings to 124t. The pickup in inflows suggest that investors viewed the September price decline as an opportunity to add gold as a strategic asset and portfolio diversifier. Inflows continued into October, with an estimated INR17.22bn (US$ 181mn) of net inflows during the first half of the month, equivalent to around 1.2t.
Despite the higher inflows, cumulative assets under management (AUM) declined by 2.5% m/m to INR1,863bn (US$19.5bn), largely reflecting the 7% fall in domestic gold prices during the month. Gold ETFs accounted for 2.25% of overall mutual fund AUM, marginally below 2.27% in January’26.
Investor participation also picked up. Gold ETFs added 140,231 new folios (accounts) during September, a marked increase from around 4,000 in August, taking the total number of folios to 12.68mn. This increase suggests that the price pullback encouraged broader investor participation, highlighting continued interest in gold as a long-term portfolio allocation.
Chart 3: Higher inflows
Gold ETF flows in INRbn, and total holdings in tonnes*
*As of end September 2026.
Source: AMFI, ICRA Analytics, CMIE, World Gold Council
Temporary suspension of fresh subscriptions into gold Fund of Funds
Mutual funds, which invest in gold ETFs, have announced a temporary suspension of fresh/ additional subscriptions into gold savings/Fund of Funds (FoFs), with effect from 16 October 2026.5
The restriction does not apply to existing systematic investment plans (SIPs) or redemption requests. While no reason has been provided for the move, it reportedly follows discussions with the Securities and Exchange Board of India (SEBI) and is likely aimed at lowering gold imports. This latest move follows the limits placed on large direct subscriptions into gold ETFs and gold FoFs, which occurred in early June.
Gold ETFs have seen sustained inflows. During Jan-Sep this year, ETF demand totalled 29t, equivalent to around 7% of gold imports, compared with about 5% a year earlier.
As the suspension applies only to fresh subscriptions into gold FoFs, investment in gold ETFs can continue as before, including the creation of ETF units and the normal functioning of market makers and authorised participants. Existing SIP contributions into FoFs are also permitted and would continue to be deployed into the underlying gold ETFs. Anecdotal feedback from industry participants suggests that the near-term impact on Indian gold ETF flows is likely to be limited.
That said, the FoF segment represents a sizeable part of the gold ETF market. The cumulative AUM of gold FoFs as of end-September stood at INR633bn(US$6.63bn), equivalent to around one-third of the INR1,863bn (US$19.5bn) held in gold ETFs overall. The share, however, varies across individual ETFs, and is around 20% for some of the largest. While the suspension could moderate incremental ETF inflows through the FoF channel, the AUM share does not necessarily reflect their contribution to inflows. The overall impact may thus be relatively contained given the continuation of direct ETF investments and existing FoF SIPs.
Demand for digital gold builds
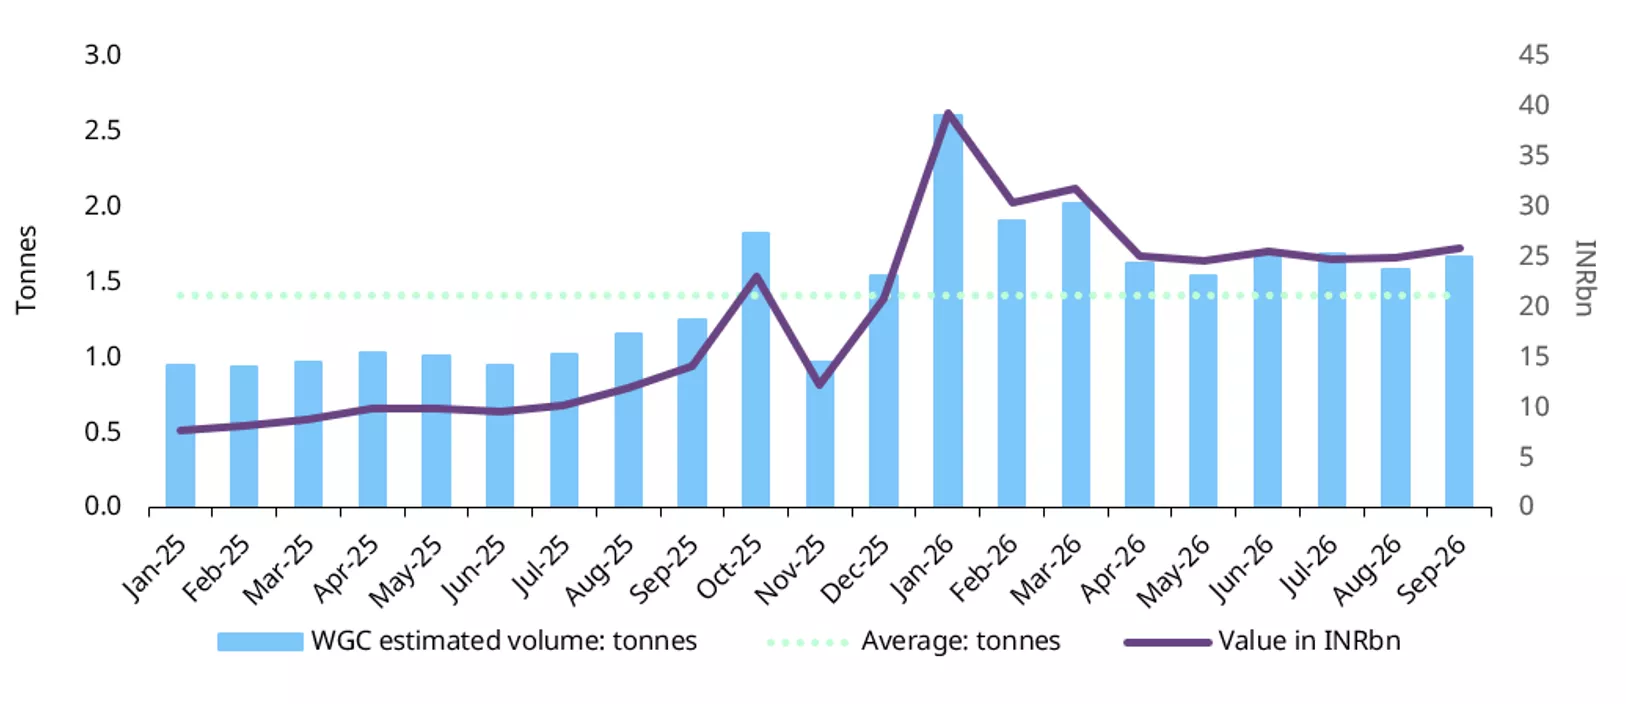
Digital gold demand remained firm in September, with purchases rising to INR25.9bn (US$271mn), up 4% from August, 83% higher than a year earlier and 4% above the average monthly purchase value recorded over the previous five months. Volumes reached 1.7t, 18% above the long-term monthly average since January 2025. On a y-t-d basis, purchases totalled 16.3t compared with 9.2t in the corresponding period of 2025, reflecting 76% growth. The strength in digital gold suggests that consumers continue to be attracted to this convenient way of investing due to its accessibility, convenience and low minimum investment.
Chart 4: Digital gold buying edges higher
Purchase of digital gold, by value and estimated volume
Source: NPCI, World Gold Council
Futures trading eases slightly but stays firm
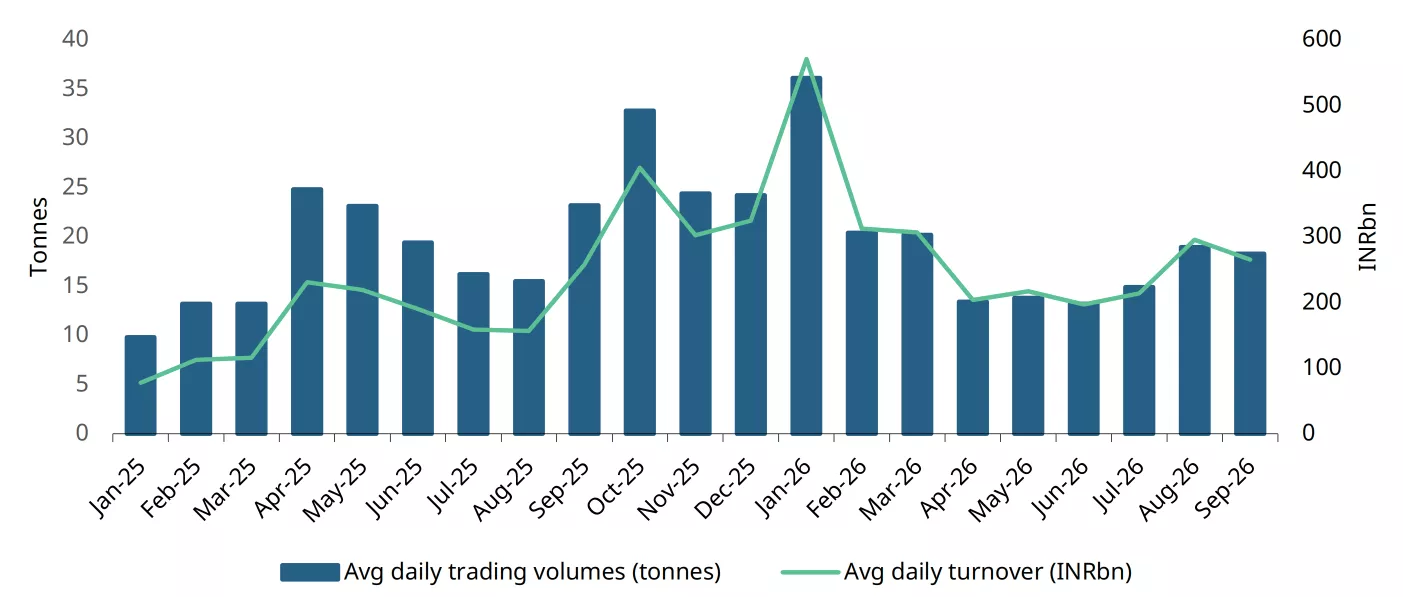
Gold futures trading on the Multi-Commodity Exchange of India (MCX) remained elevated in September, although activity eased from August’s five-month high. Average daily trading volumes moderated 4% m/m to 18.3t, while turnover fell at a faster pace, down 10% m/m to INR265bn (US$2.8bn), reflecting lower gold prices. Despite the moderation, market participation remained healthy, with both volumes and turnover approximately 20% above the April-August averages, suggestive of continued interest for hedging and tactical positioning.
Chart 5: Gold Futures trading holds steady
Gold futures trading on MCX; volume and turnover
Source: MCX India, World Gold Council
Lower imports
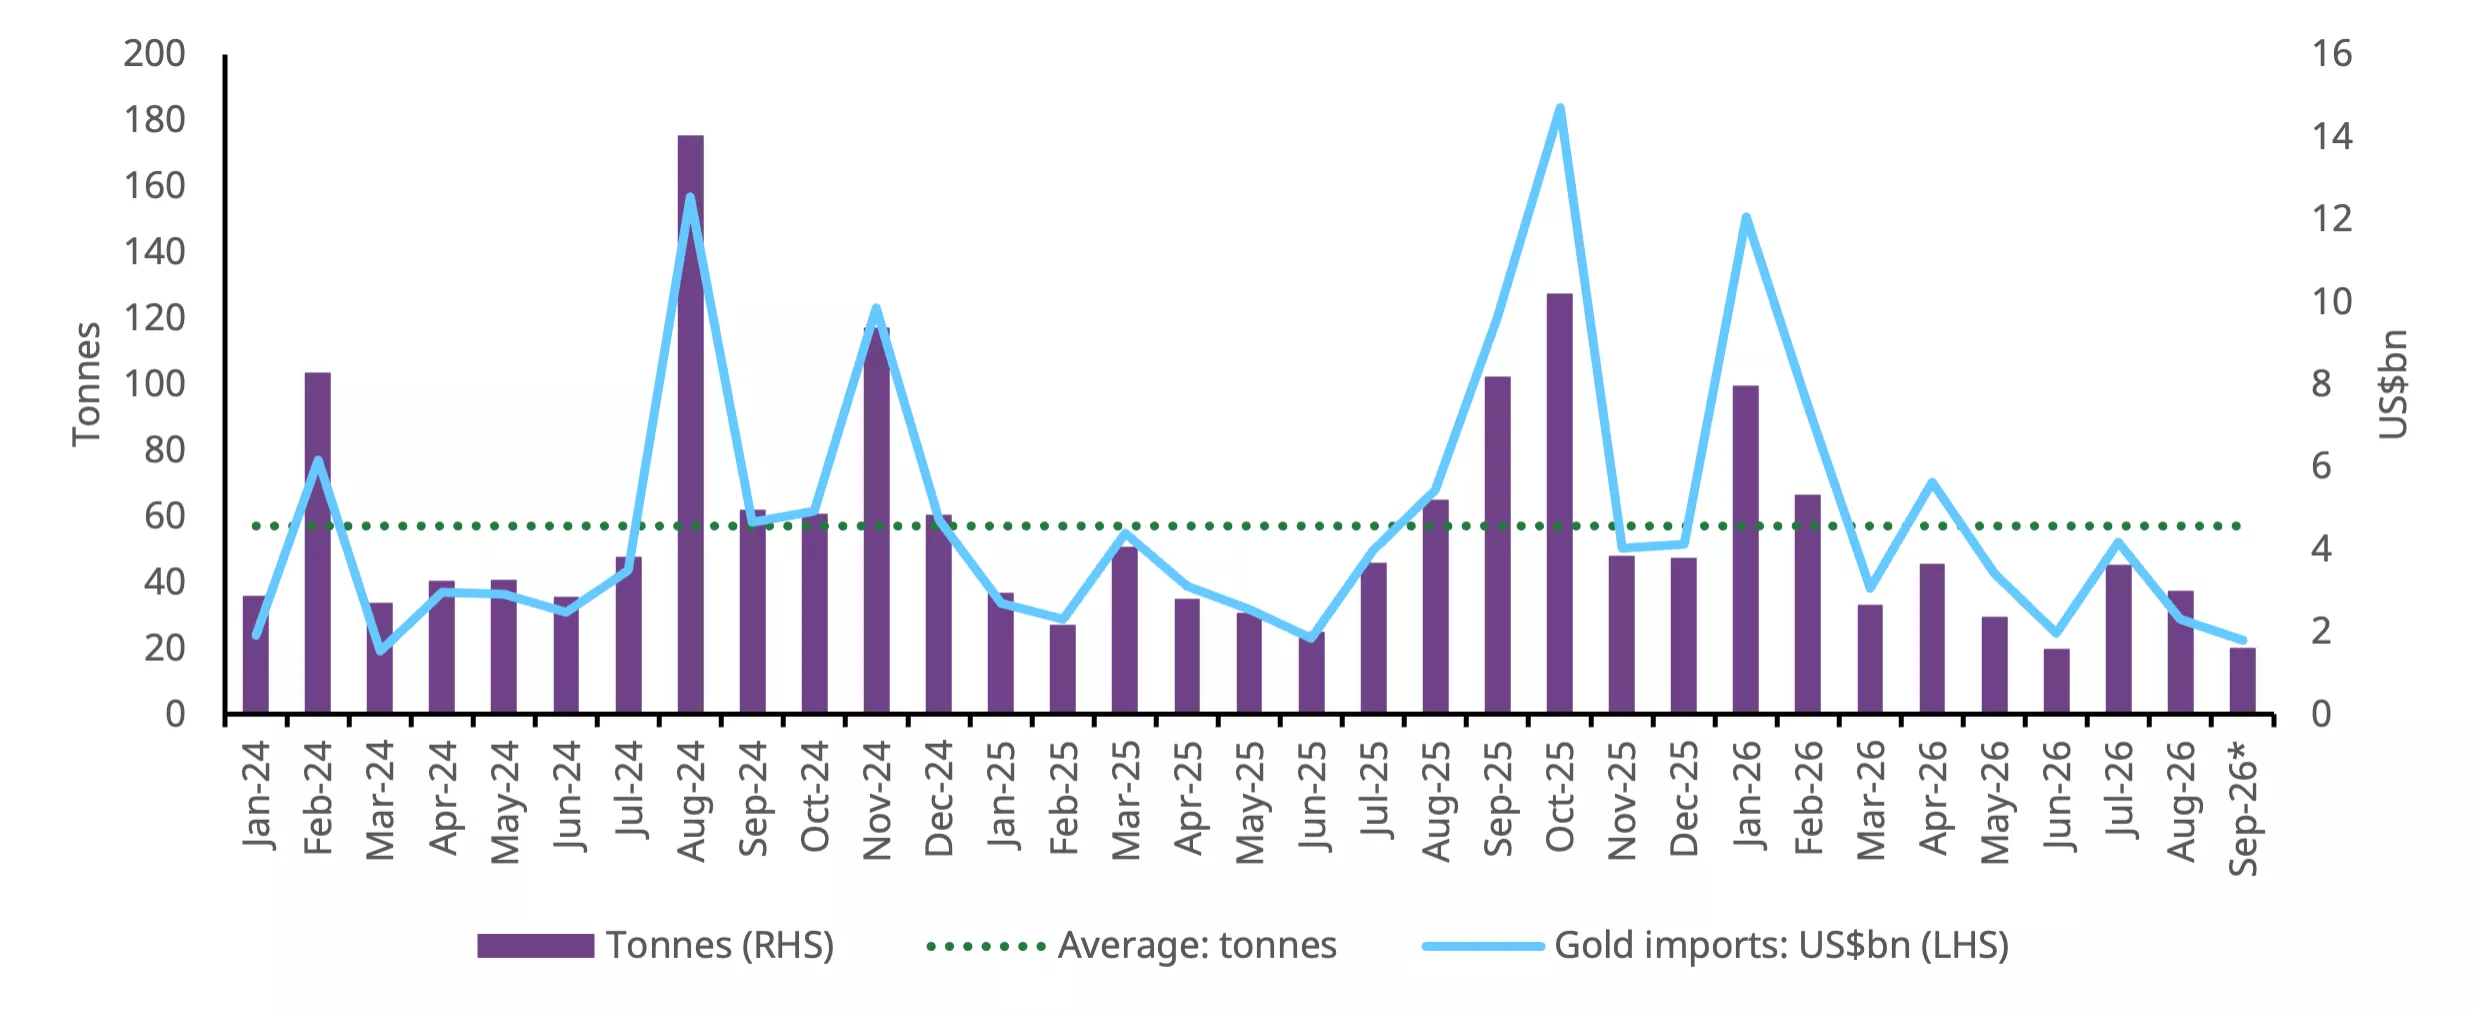
Gold imports fell sharply in September to US$1.8bn, the lowest level since March 2024 and down 22% m/m and 81% y/y. Gross import volumes are estimated at around 20t, while gold’s share of total merchandise imports fell to 2.4% from 14% a year earlier. This sharp decline, despite the approaching festive season, likely reflects greater availability of domestic supply, including recycled gold generated through old-gold exchange programmes.
Chart 6: Import demand weakens
Monthly gold imports in tonnes and US$bn*
*Includes World Gold Council estimates.
Source: Ministry of Commerce and Industry, CMIE, World Gold Council
Footnotes
1LBMA Gold Price PM and MCX spot gold price as of 11 September 2026.
2LBMA Gold Price PM.
3MCX spot gold price.
4Titan Company, Kalyan Jewellers, PC Jewellers, P N Gadgil Jewellers Ltd, Senco Gold
5Mutual funds halt new gold FoF investments, ETF channel kept open, Business Standard, 17 October, 2026
Disclaimer
Important information and disclaimers
© 2026 World Gold Council. All rights reserved. World Gold Council and the Circle device are trademarks of the World Gold Council or its affiliates.
All references to LBMA Gold Price are used with the permission of ICE Benchmark Administration Limited and have been provided for informational purposes only. ICE Benchmark Administration Limited accepts no liability or responsibility for the accuracy of the prices or the underlying product to which the prices may be referenced. Other content is the intellectual property of the respective third party and all rights are reserved to them.
Reproduction or redistribution of any of this information is expressly prohibited without the prior written consent of World Gold Council or the appropriate copyright owners, except as specifically provided below. Information and statistics are copyright © and/or other intellectual property of the World Gold Council or its affiliates or third-party providers identified herein. All rights of the respective owners are reserved.
The use of the statistics in this information is permitted for the purposes of review and commentary (including media commentary) in line with fair industry practice, subject to the following two pre-conditions: (i) only limited extracts of data or analysis be used; and (ii) any and all use of these statistics is accompanied by a citation to World Gold Council and, where appropriate, to Metals Focus or other identified copyright owners as their source. World Gold Council is affiliated with Metals Focus.
The World Gold Council and its affiliates do not guarantee the accuracy or completeness of any information nor accept responsibility for any losses or damages arising directly or indirectly from the use of this information.
This information is for educational purposes only and by receiving this information, you agree with its intended purpose. Nothing contained herein is intended to constitute a recommendation, investment advice, or offer for the purchase or sale of gold, any gold-related products or services or any other products, services, securities or financial instruments (collectively, “Services”). This information does not take into account any investment objectives, financial situation or particular needs of any particular person.
Diversification does not guarantee any investment returns and does not eliminate the risk of loss. Past performance is not necessarily indicative of future results. The resulting performance of any investment outcomes that can be generated through allocation to gold are hypothetical in nature, may not reflect actual investment results and are not guarantees of future results. The World Gold Council and its affiliates do not guarantee or warranty any calculations and models used in any hypothetical portfolios or any outcomes resulting from any such use. Investors should discuss their individual circumstances with their appropriate investment professionals before making any decision regarding any Services or investments.
This information may contain forward-looking statements, such as statements which use the words “believes”, “expects”, “may”, or “suggests”, or similar terminology, which are based on current expectations and are subject to change. Forward-looking statements involve a number of risks and uncertainties. There can be no assurance that any forward-looking statements will be achieved. World Gold Council and its affiliates assume no responsibility for updating any forward-looking statements.
Information regarding the LBMA Gold Price
The LBMA Gold Price is used by the World Gold Council with permission under license by ICE Benchmark Administration Limited and is subject to the restrictions set forth here (www.gold.org/terms-and-conditions).
Information regarding QaurumSM and the Gold Valuation Framework
Note that the resulting performance of various investment outcomes that can be generated through use of Qaurum, the Gold Valuation Framework and other information are hypothetical in nature, may not reflect actual investment results and are not guarantees of future results. Neither World Gold Council (including its affiliates) nor Oxford Economics provides any warranty or guarantee regarding the functionality of the tool, including without limitation any projections, estimates or calculations.
Information from ICRA Analytics Limited
All information obtained from ICRA Analytics Limited contained in this document is subject to the disclaimer set forth here (www.icraanalytics.com/terms-of-use/disclaimer).