China gold market update: Official buying accelerated in May
12 June, 2026
Highlights
- Gold weakened in May as geopolitical uncertainties kept investors wary of inflation risks and higher rates
- Outflows in May ended an eight-month inflow streak for Chinese ETFs and brought total assets under management (AUM) down 5% to RMB289bn (US$43bn). Gold futures trading volumes at the Shanghai Futures Exchange (SHFE) remained stable
- Wholesale demand fell notably in May amid easing investment momentum and a still-weak jewellery sector
- The People’s Bank of China (PBoC) reported a 10t gold purchase in May, the highest since December 2024, pushing total official gold holdings to 2,332t, 9% of total reserves
- Gold trended down further in the first week of June; Chinese gold ETFs’ outflows continued. Meanwhile, trading volumes of Au9999 lowered, indicating tepid gold demand in early June.
Looking ahead
- Seasonality suggests stability in the gold jewellery sector as the industry replenishes following weak buying in previous months. The lower gold price may help boost these re-stocking activities, although jewellers may sit on the sidelines if the price weakness accelerates. On the investment side, a cooling gold price momentum could further limit bullion buying.
Gold weakened
Gold ended May with a modest decline. The LBMA Gold Price PM was down 1.4% and the Shanghai Gold Benchmark Price PM (SHAUPM) fell by 2.7% – as the RMB strengthened it exacerbated the weakness in the Chinese gold price (Chart 1). Uncertainties in the Middle East and related inflationary concerns – which pushed yields and the dollar up – were key drivers of gold in the month.
Chart 1: Gold was weaker in May
Monthly returns of SHAUPM in RMB and LBMA Gold Price PM in USD*
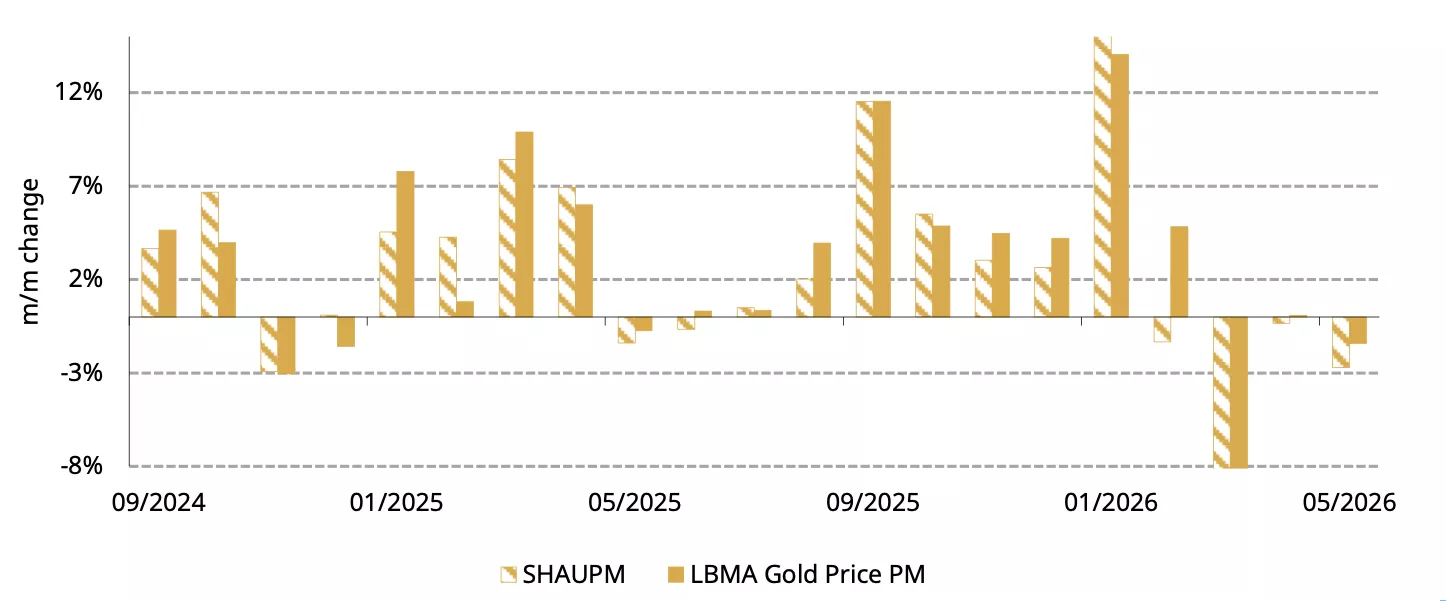
*Data to 31 May 2026.
Source: Shanghai Gold Exchange, ICE Benchmark Administration, World Gold Council
Chinese gold ETFs saw outflows and futures volumes stabilised
Chinese gold ETFs saw their first monthly outflow since August 2025, shedding RMB8.2bn (US$1.2bn) in May. Combined with a lower gold price, total AUM declined by 5% to RMB289bn (US$43bn). Chinese gold ETF holdings had dropped 8.3t to 293t by the end of the month (Chart 2).
Sustained local equity market strength diverted investor interest away from gold. And the lack of a clear gold price trend prompted some to sell their gold ETF holdings.
Chart 2: Chinese gold ETFs saw their first monthly outflow in eight months
Chinese gold ETF demand and holdings in tonnes*
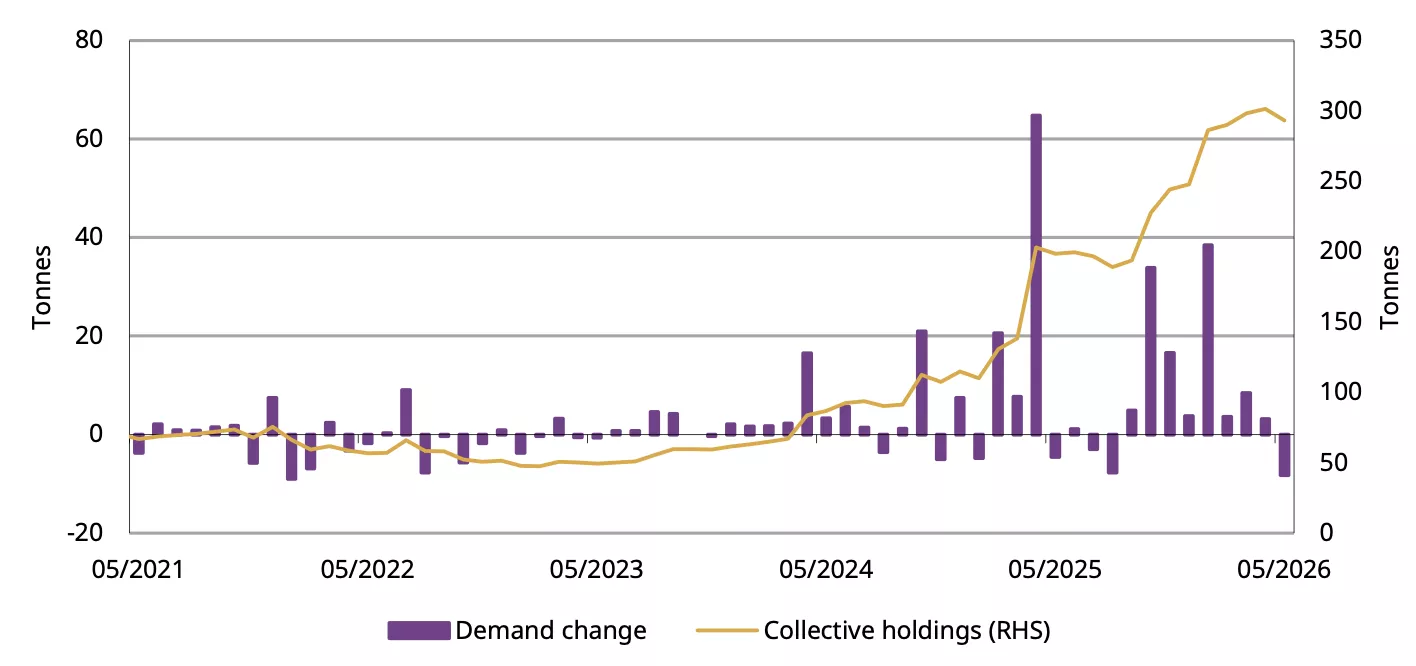
*Data to 31 May 2026.
Source: Company filings, World Gold Council
Gold futures trading volumes on the SHFE stayed stable, averaging 301t per day in May (Chart 3). This was little changed from April’s 307t/day as trading activities were constrained by the consolidating local gold price and elevated investor interest in the local equity market.
Chart 3: Gold futures volumes almost unchanged in May
Daily average trading volumes of SHFE gold futures and monthly gold price volatility*
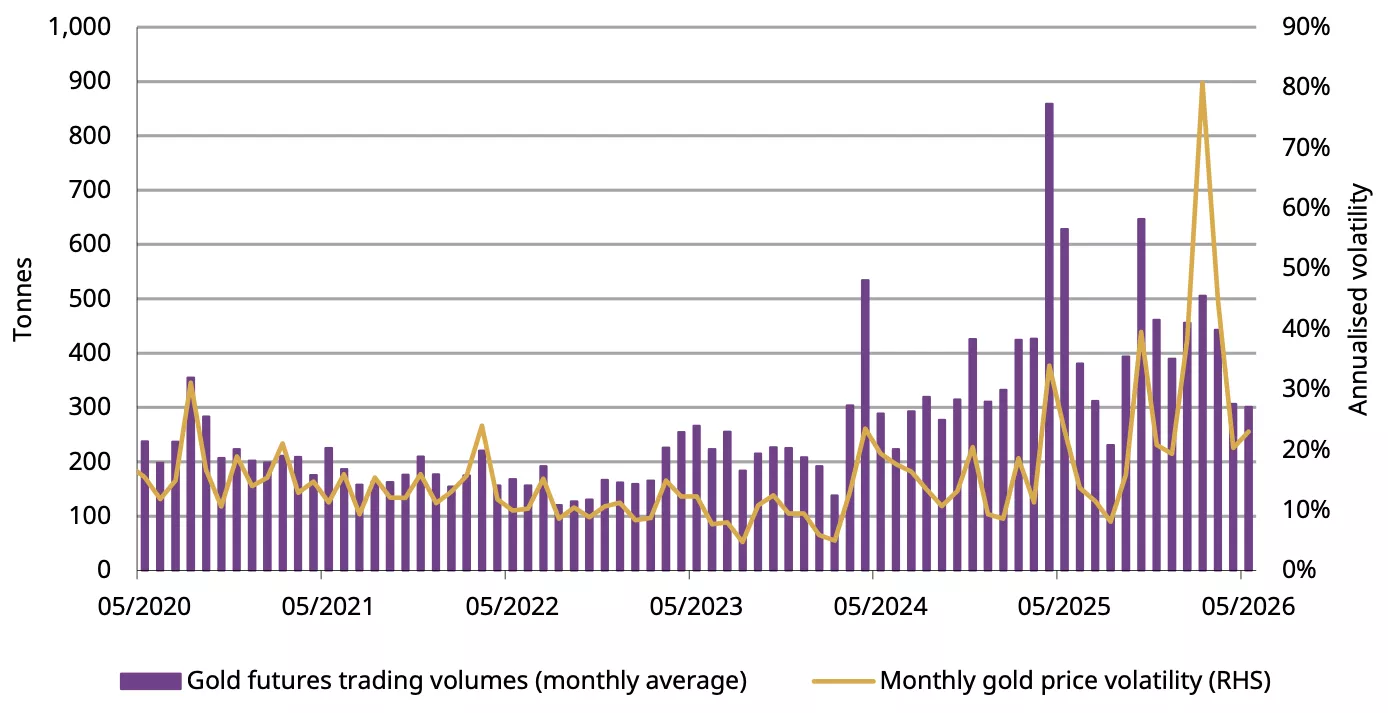
*As of 31 May 2026.
Source: Shanghai Futures Exchange, World Gold Council
Wholesale demand kept declining
Wholesale gold demand fell notably in May (Chart 4). Gold withdrawals from the SGE totalled 64t, 38% lower m/m. The m/m decline is mainly seasonal, as noted previously.
On a y/y basis, withdrawals declined by 36%, making this the weakest May since 2010. The weakening gold price during the month, along with attention-grabbing equities, dented safe-haven demand for gold investment products. And persistent weakness in the gold jewellery sector amid affordability issues and additional tax burdens – despite mild upticks during May as the price stabilised – kept jewellers cautious in restocking. Taken together, May’s wholesale demand took a hit, falling to a multi-year low.
Chart 4: Wholesale demand fell to a multi-year low in May
Gold withdrawals from the SGE by month and the ten-year monthly average*
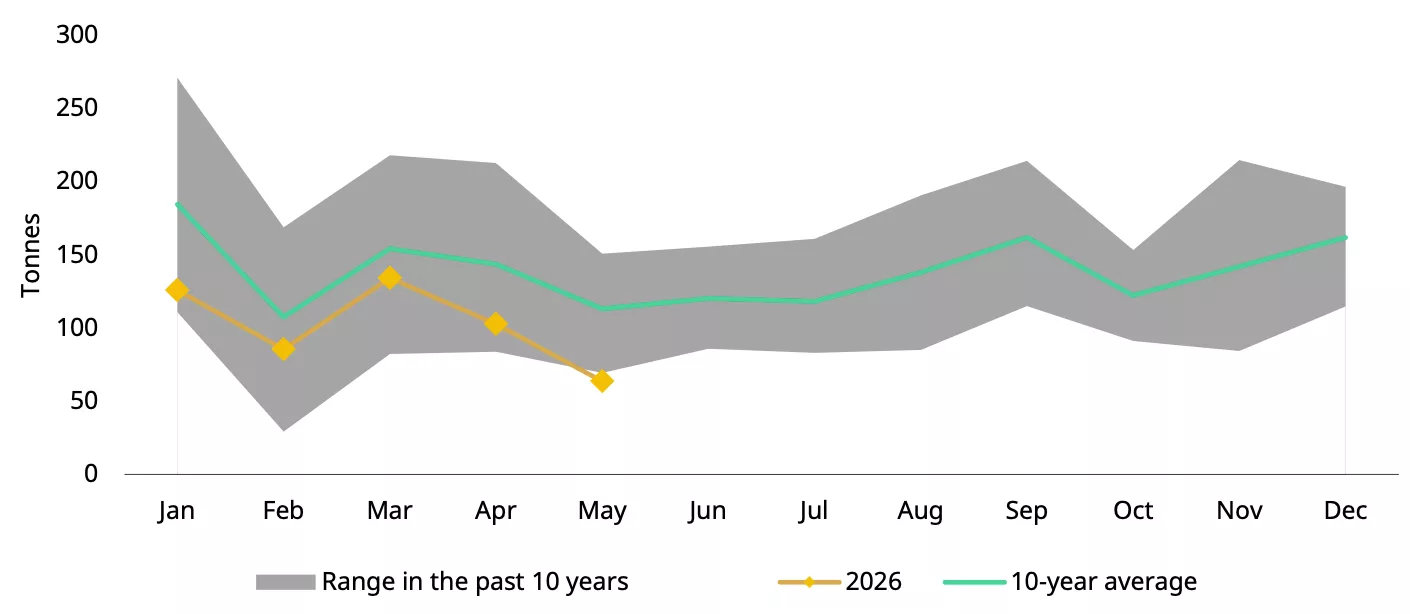
*Ten-year average based on data between 2016 and 2025.
Source: Shanghai Gold Exchange, World Gold Council
The PBoC ramped up gold buying
The PBoC announced its 19th consecutive monthly gold reserve increase in May, pushing official holdings 10t higher to 2,332t (Chart 5). This marks the strongest month of official sector gold purchases since December 2024. Official gold holdings have risen by 25t y-t-d and now account for 8.9% of China’s foreign exchange reserves. The country’s official sector has accumulated 67t of gold during the past 19 months.
Chart 5: Official gold purchases picked up in May
The PBoC’s reported gold purchases and gold’s share of total foreign exchange reserves*
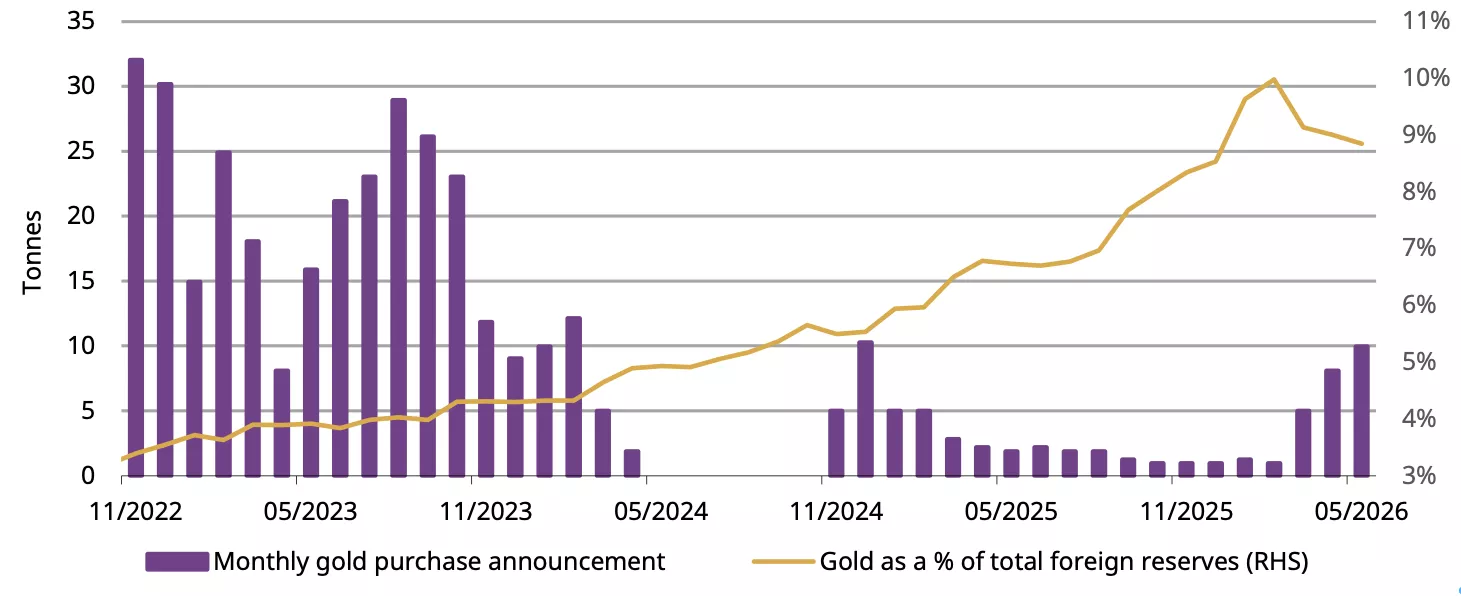
*Data to May 2026.
Source: State Administration of Foreign Exchanges, World Gold Council
Imports rose further in April
Net gold imports into China totalled 157t in April, according to the most recent data from China Customs, rising 10% m/m and 40% higher y/y and making this the strongest month since March 2024. The positive local gold price spread remained a key factor in encouraging imports.
Chart 6: Gold imports continued to rise in April
Net gold imports under HS7108*
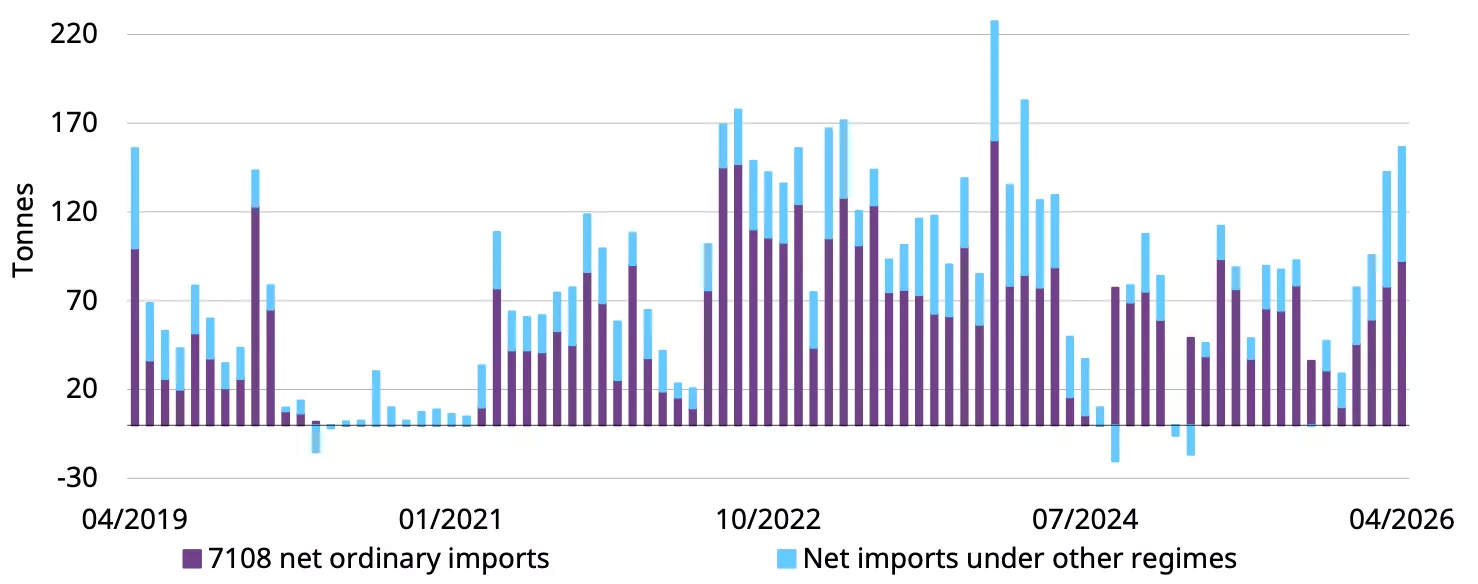
*Data to April 2026.
Source: China Customs, World Gold Council
Disclaimer
Important information and disclaimers
© 2026 World Gold Council. All rights reserved. World Gold Council and the Circle device are trademarks of the World Gold Council or its affiliates.
All references to LBMA Gold Price are used with the permission of ICE Benchmark Administration Limited and have been provided for informational purposes only. ICE Benchmark Administration Limited accepts no liability or responsibility for the accuracy of the prices or the underlying product to which the prices may be referenced. Other content is the intellectual property of the respective third party and all rights are reserved to them.
Reproduction or redistribution of any of this information is expressly prohibited without the prior written consent of World Gold Council or the appropriate copyright owners, except as specifically provided below. Information and statistics are copyright © and/or other intellectual property of the World Gold Council or its affiliates or third-party providers identified herein. All rights of the respective owners are reserved.
The use of the statistics in this information is permitted for the purposes of review and commentary (including media commentary) in line with fair industry practice, subject to the following two pre-conditions: (i) only limited extracts of data or analysis be used; and (ii) any and all use of these statistics is accompanied by a citation to World Gold Council and, where appropriate, to Metals Focus or other identified copyright owners as their source. World Gold Council is affiliated with Metals Focus.
The World Gold Council and its affiliates do not guarantee the accuracy or completeness of any information nor accept responsibility for any losses or damages arising directly or indirectly from the use of this information.
This information is for educational purposes only and by receiving this information, you agree with its intended purpose. Nothing contained herein is intended to constitute a recommendation, investment advice, or offer for the purchase or sale of gold, any gold-related products or services or any other products, services, securities or financial instruments (collectively, “Services”). This information does not take into account any investment objectives, financial situation or particular needs of any particular person.
Diversification does not guarantee any investment returns and does not eliminate the risk of loss. Past performance is not necessarily indicative of future results. The resulting performance of any investment outcomes that can be generated through allocation to gold are hypothetical in nature, may not reflect actual investment results and are not guarantees of future results. The World Gold Council and its affiliates do not guarantee or warranty any calculations and models used in any hypothetical portfolios or any outcomes resulting from any such use. Investors should discuss their individual circumstances with their appropriate investment professionals before making any decision regarding any Services or investments.
This information may contain forward-looking statements, such as statements which use the words “believes”, “expects”, “may”, or “suggests”, or similar terminology, which are based on current expectations and are subject to change. Forward-looking statements involve a number of risks and uncertainties. There can be no assurance that any forward-looking statements will be achieved. World Gold Council and its affiliates assume no responsibility for updating any forward-looking statements.
Information regarding the LBMA Gold Price
The LBMA Gold Price is used by the World Gold Council with permission under license by ICE Benchmark Administration Limited and is subject to the restrictions set forth here (www.gold.org/terms-and-conditions).
Information regarding QaurumSM and the Gold Valuation Framework
Note that the resulting performance of various investment outcomes that can be generated through use of Qaurum, the Gold Valuation Framework and other information are hypothetical in nature, may not reflect actual investment results and are not guarantees of future results. Neither World Gold Council (including its affiliates) nor Oxford Economics provides any warranty or guarantee regarding the functionality of the tool, including without limitation any projections, estimates or calculations.
Information from ICRA Analytics Limited
All information obtained from ICRA Analytics Limited contained in this document is subject to the disclaimer set forth here (www.icraanalytics.com/terms-of-use/disclaimer).
