China gold market update: A notable rise in gold reserves
14 May, 2026
Highlights
- Gold ended April flat: the LBMA Gold Price PM in USD rose slightly by 0.1% while the Shanghai Gold Benchmark Price PM (SHAUPM) in RMB shed a minor 0.4% – due mainly to a stronger local currency
- Local gold ETFs added RMB3.5bn (US$498mn) in April, pushing their total assets under management (AUM) to RMB306bn (US$45bn); holdings rose 3t to 301t, a month-end peak.
- Heading into May, the local gold price stabilised above the RMB1,000/g threshold, with Chinese gold ETFs witnessing continued inflows despite sustained strength in the equity market1
- Wholesale demand fell seasonally in April, declining 23% m/m to 103t – replenishment from both jewellery retailers and banks eased
- The People’s Bank of China (PBoC) announced an 8t gold addition in April, the highest since December 2024 and the 18th consecutive monthly purchase, pushing official gold holdings to 2,322t, 9% of total reserves.
Looking ahead
- In the traditional off season for gold jewellery we expect demand in this sector to stay weak – though the stabilising gold price may offer some support; meanwhile, rising interest from local investors in the equity market rally – which started in early April – and the lack of a clear trend in the gold price may continue to discourage bullion investment.
A flat month for gold
Gold traded sideways in April, ending the month flat. The LBMA Gold Price PM in USD and the SHAUPM in RMB were little changed. Early in the month gold rebounded from March weakness as easing Middle East tensions tempered inflation concerns and weighed on yields. However, renewed uncertainty around the Strait of Hormuz later in April drove oil prices higher, dampened Fed easing expectations, and reversed gold’s earlier gains (Chart 1).
Chart 1: Gold was almost flat in April
Monthly returns of SHAUPM in RMB and LBMA Gold Price PM in USD*
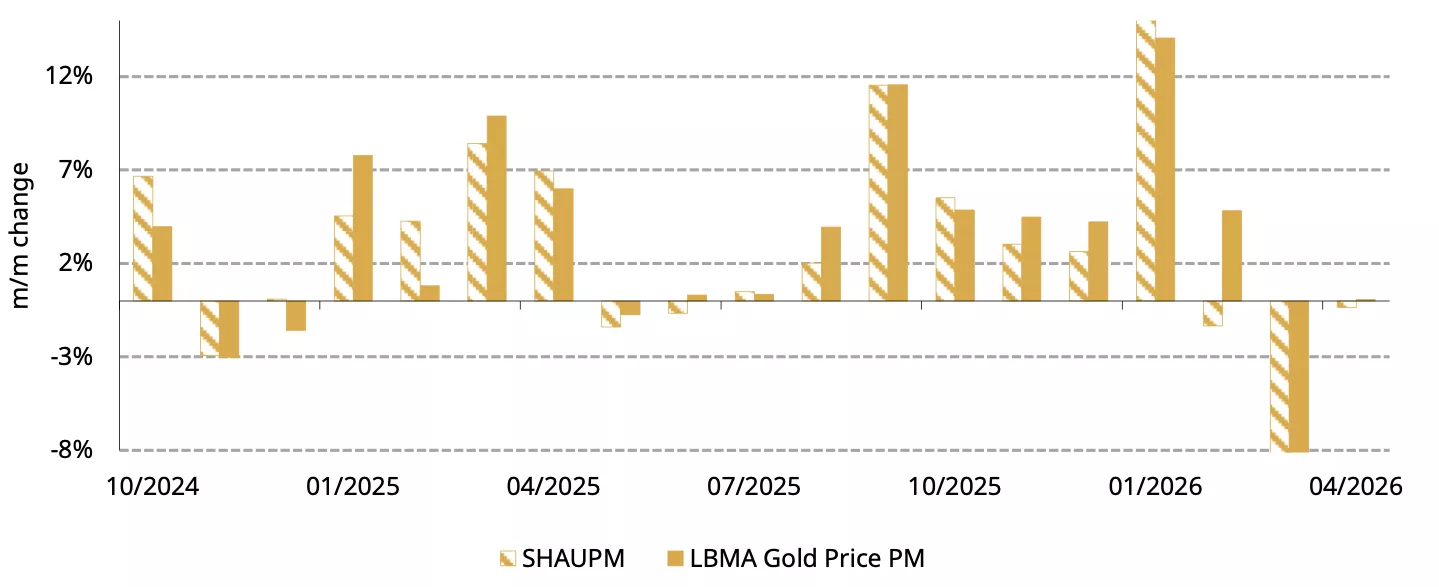
*Data to 30 April 2026.
Source: Shanghai Gold Exchange, ICE Benchmark Administration, World Gold Council
Chinese gold ETFs expanded further while futures volumes cooled
Chinese gold ETFs witnessed their eighth consecutive monthly inflow in April, attracting RMB3.5bn (US$498mn). Following another monthly expansion their total AUM reached RMB306bn (US$45bn), 1% higher m/m. Meanwhile, collective holdings increased 3t to 301t, another month-end peak (Chart 2).
Continued global and regional geopolitical tensions during the month, as well as falling local government bond yields, sustained Chinese investor interest in gold. Nonetheless, inflows slowed as investors may have been diverted to the rallying equity market.
With the local gold price stabilising in May, we see continued allocation to gold ETFs from local investors even as the local stock market kept rallying.
Chart 2: Demand for Chinese gold ETFs persisted
Chinese gold ETF demand and holdings in tonnes*
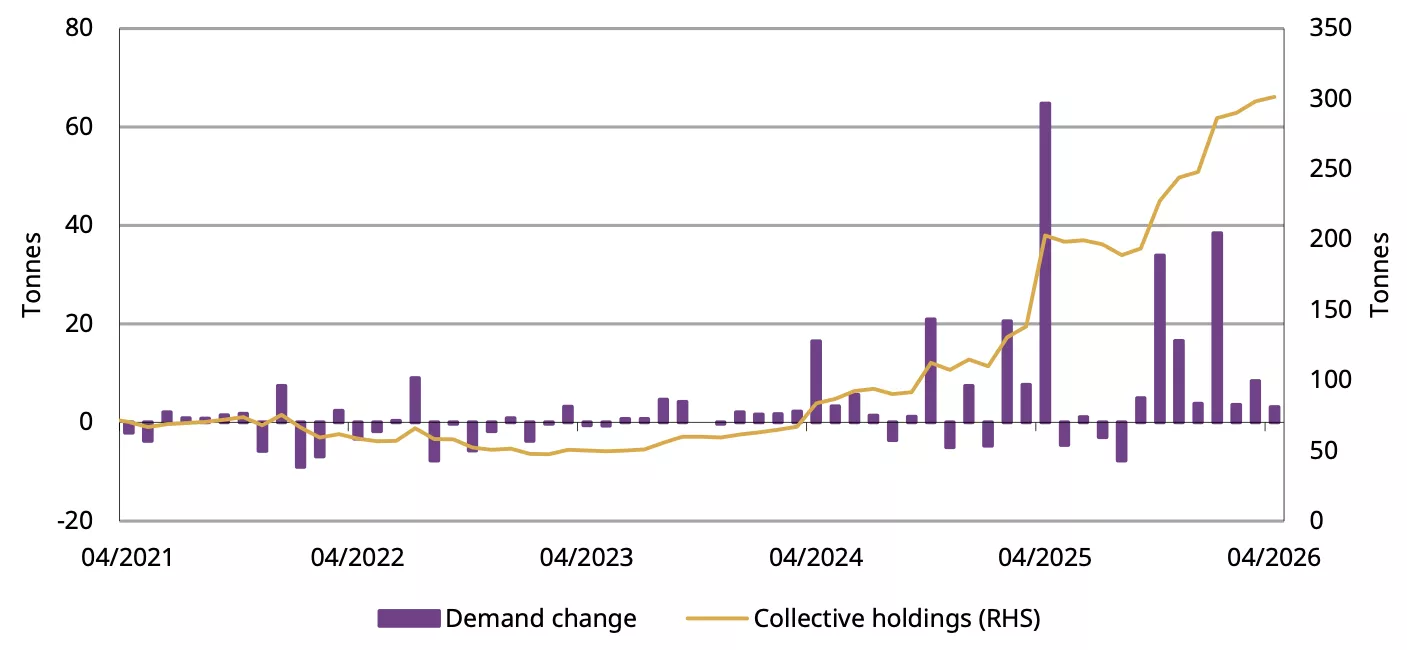
*Data to 30 April 2026.
Source: Company filings, World Gold Council
Chinese gold futures trading activities cooled further in April (Chart 3). Despite a 31% m/m decline, volumes of gold futures traded at the Shanghai Futures Exchange (SHFE) – at 307t/day – remained well above the five-year daily average of 265t. Trader interest in gold futures weakened as amid local stock market strength and easing gold price volatility.
Chart 3: Gold futures volumes fell alongside the cooling price volatility
Daily average trading volumes of SHFE gold futures and monthly gold price volatility*
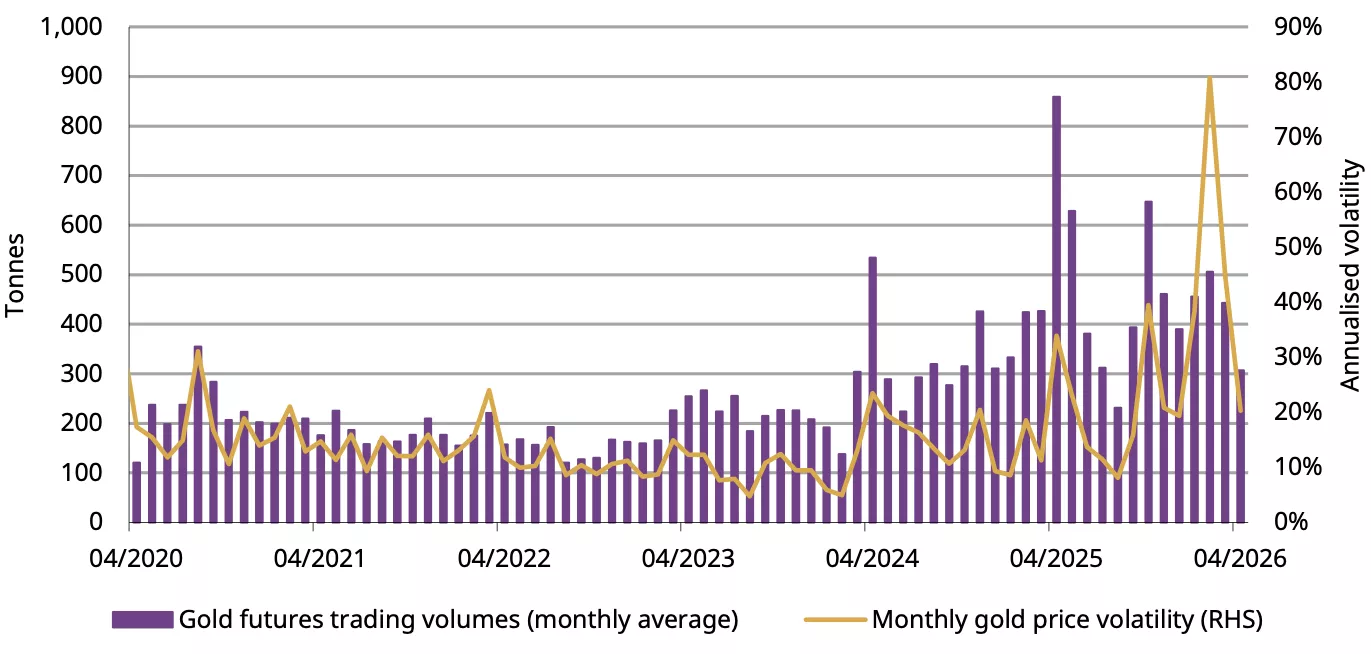
*As of 30 April 2026.
Source: Shanghai Futures Exchange, World Gold Council
Wholesale demand weakened seasonally
Gold withdrawals from the SGE totalled 103t in April, a 23% m/m fall (Chart 4). The m/m weakness followed a seasonal pattern: restocking falls in April as gold jewellery consumption enters its traditional Q2 off season. Although there was some replenishment ahead of the early‑May Labour Day holiday – historically a boost for jewellery sales – the impact was limited as consumer spending continues to shift toward experiences such as travel. Meanwhile, bullion sales, while still healthy, cooled from the previous buying frenzy as strong equities and the easing gold price momentum dimmed investor interest in gold.
On a y/y basis, April wholesale demand fell 33%, due in part to a high comparison base: in 2025 demand reached its strongest April level since 2018. Weaker wholesale demand has, however, been evident generally this year, due mainly to the downturn in the gold jewellery sector.
Chart 4: Wholesale gold demand on a seasonal path, only weaker
Gold withdrawals from the SGE by month and the ten-year monthly average*
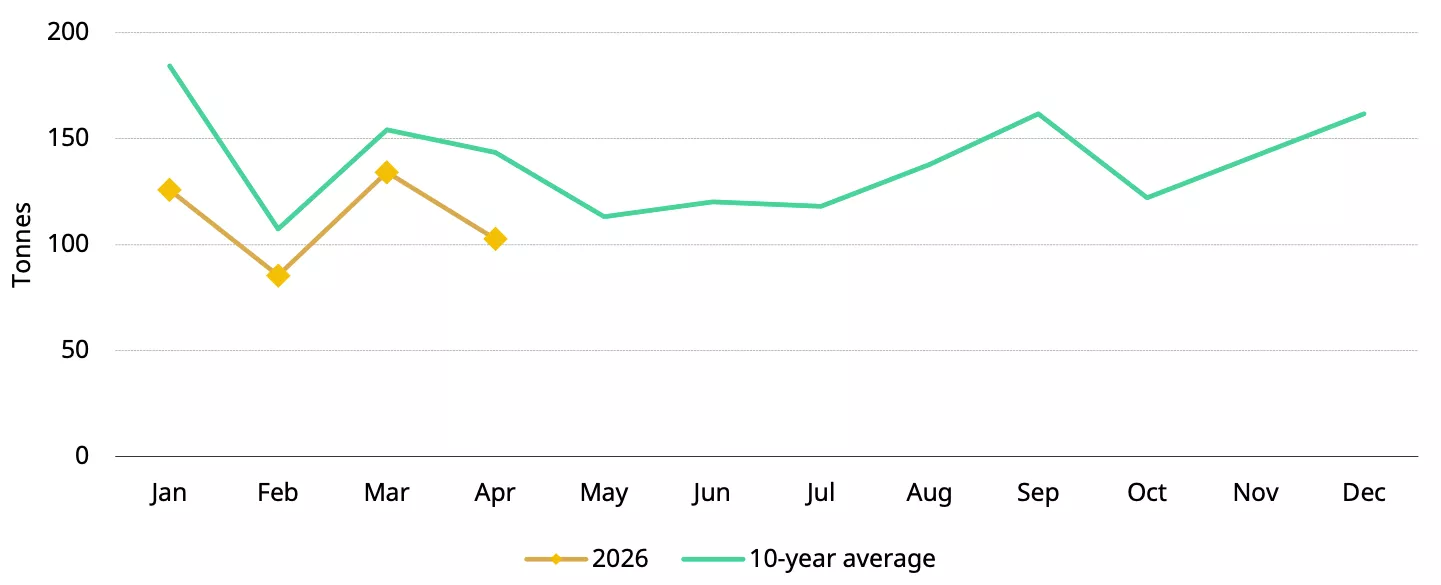
*Ten-year average based on data between 2016 and 2025.
Source: Shanghai Gold Exchange, World Gold Council
The PBoC added the most gold in 15 months
The PBoC reported an 8t gold purchase in April, its 18th consecutive monthly addition and the highest since December 2024 (Chart 5). This addition brought Chinese official gold holdings to 2,322t, 9% of the country’s total official reserves, which rose 2% to US$3.8tn.
Chart 5: The 18th non-stop monthly Chinese gold reserve addition
The PBoC’s reported gold purchases and gold’s share of total foreign exchange reserves*
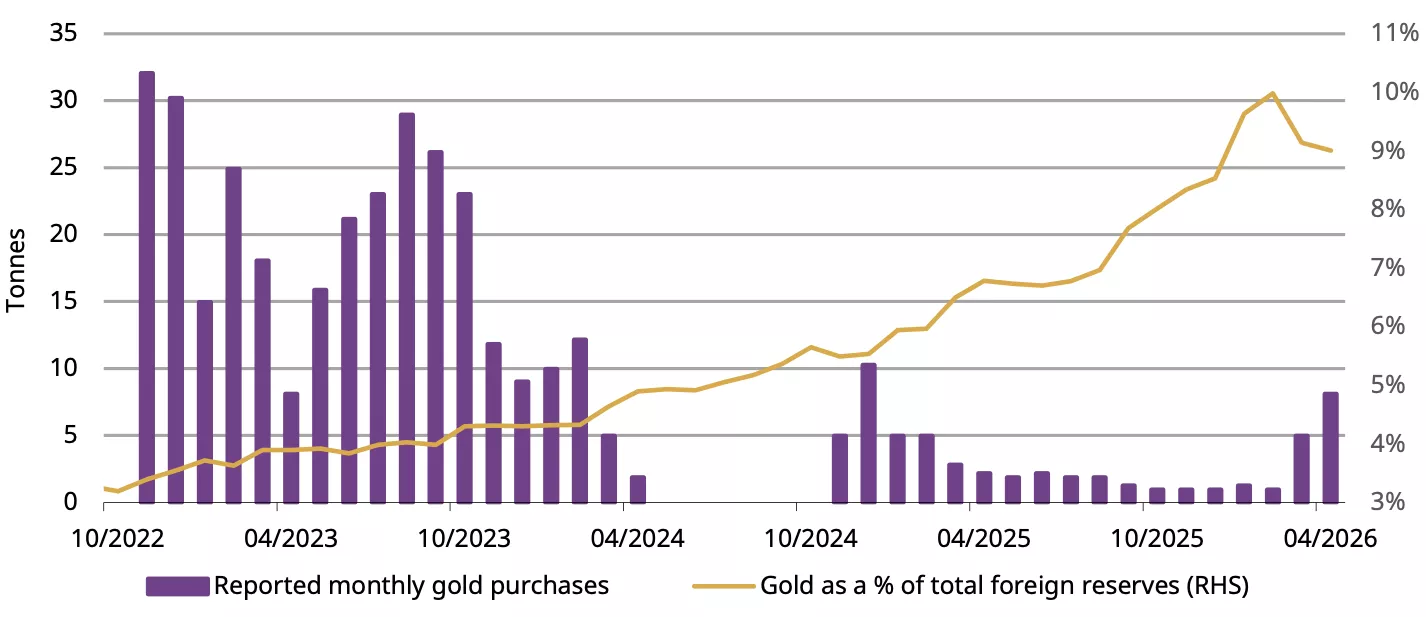
*Data to April 2026.
Source: State Administration of Foreign Exchanges, World Gold Council
Imports rebounded notably in Q1
China imported 143t of gold on a net basis in March, a notable 49% m/m rise. The March rebound brought Q1 net gold imports to 316t, surging both q/q (+182%) and y/y (+333%) (Chart 6). This is in line with robust Chinese gold consumption, as strong bullion investment offset weak jewellery buying, during the quarter. Meanwhile, positive local gold price spread throughout the quarter also encouraged importers.
Chart 6: Q1 gold imports rose notably
Net gold imports under HS7108*
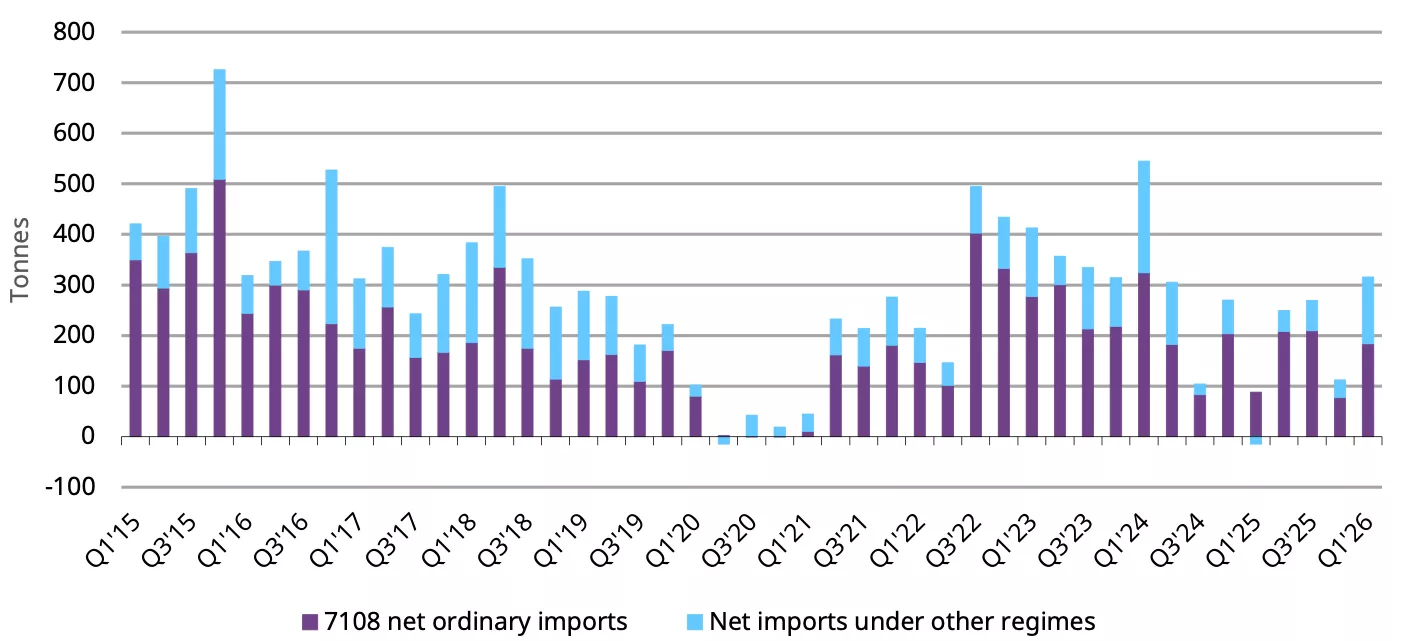
*Data to March 2026.
Source: China Customs, World Gold Council
Footnotes
1Based on data as of 11 May 2026.
Disclaimer
Important information and disclaimers
© 2026 World Gold Council. All rights reserved. World Gold Council and the Circle device are trademarks of the World Gold Council or its affiliates.
All references to LBMA Gold Price are used with the permission of ICE Benchmark Administration Limited and have been provided for informational purposes only. ICE Benchmark Administration Limited accepts no liability or responsibility for the accuracy of the prices or the underlying product to which the prices may be referenced. Other content is the intellectual property of the respective third party and all rights are reserved to them.
Reproduction or redistribution of any of this information is expressly prohibited without the prior written consent of World Gold Council or the appropriate copyright owners, except as specifically provided below. Information and statistics are copyright © and/or other intellectual property of the World Gold Council or its affiliates or third-party providers identified herein. All rights of the respective owners are reserved.
The use of the statistics in this information is permitted for the purposes of review and commentary (including media commentary) in line with fair industry practice, subject to the following two pre-conditions: (i) only limited extracts of data or analysis be used; and (ii) any and all use of these statistics is accompanied by a citation to World Gold Council and, where appropriate, to Metals Focus or other identified copyright owners as their source. World Gold Council is affiliated with Metals Focus.
The World Gold Council and its affiliates do not guarantee the accuracy or completeness of any information nor accept responsibility for any losses or damages arising directly or indirectly from the use of this information.
This information is for educational purposes only and by receiving this information, you agree with its intended purpose. Nothing contained herein is intended to constitute a recommendation, investment advice, or offer for the purchase or sale of gold, any gold-related products or services or any other products, services, securities or financial instruments (collectively, “Services”). This information does not take into account any investment objectives, financial situation or particular needs of any particular person.
Diversification does not guarantee any investment returns and does not eliminate the risk of loss. Past performance is not necessarily indicative of future results. The resulting performance of any investment outcomes that can be generated through allocation to gold are hypothetical in nature, may not reflect actual investment results and are not guarantees of future results. The World Gold Council and its affiliates do not guarantee or warranty any calculations and models used in any hypothetical portfolios or any outcomes resulting from any such use. Investors should discuss their individual circumstances with their appropriate investment professionals before making any decision regarding any Services or investments.
This information may contain forward-looking statements, such as statements which use the words “believes”, “expects”, “may”, or “suggests”, or similar terminology, which are based on current expectations and are subject to change. Forward-looking statements involve a number of risks and uncertainties. There can be no assurance that any forward-looking statements will be achieved. World Gold Council and its affiliates assume no responsibility for updating any forward-looking statements.
Information regarding the LBMA Gold Price
The LBMA Gold Price is used by the World Gold Council with permission under license by ICE Benchmark Administration Limited and is subject to the restrictions set forth here (www.gold.org/terms-and-conditions).
Information regarding QaurumSM and the Gold Valuation Framework
Note that the resulting performance of various investment outcomes that can be generated through use of Qaurum, the Gold Valuation Framework and other information are hypothetical in nature, may not reflect actual investment results and are not guarantees of future results. Neither World Gold Council (including its affiliates) nor Oxford Economics provides any warranty or guarantee regarding the functionality of the tool, including without limitation any projections, estimates or calculations.
Information from ICRA Analytics Limited
All information obtained from ICRA Analytics Limited contained in this document is subject to the disclaimer set forth here (www.icraanalytics.com/terms-of-use/disclaimer).
