India gold market update: Mixed reading
17 April, 2026
Highlights
- Gold prices partially recovered in April1 following the sharp March decline, while import curbs and supply bottlenecks narrowed domestic discounts
- Listed jewellers posted strong y/y growth in Q1 2026, driven by wedding as well as discretionary spends, higher ticket sizes, and ongoing expansion
- Redemptions dampened gold ETF inflows, but holdings and investor participation continued to rise
- Digital gold purchases remained firm, well above recent averages
- Reserve Bank of India’s gold reserve holdings remained steady amid a decline in total forex reserves
- Imports hit 9-month low in March.
Looking ahead
- Demand is expected to be supported by the summer wedding season and key buying occasions such as Akshaya Tritiya2 and regional festivals, with price stability driving buying interest.
Partial price recovery following sharp March decline
Gold prices declined sharply in March in both US dollar and INR terms, marking the weakest monthly performance in nearly 13 and 12 years respectively. Prices fell by 12% in USD and 8% in INR terms, with the relatively lower decline in domestic prices linked to the depreciation in the INR (by 4%). The price decline was driven by momentum factors – outflows from global gold ETFs and an unwind of COMEX net long positions, alongside higher opportunity costs due to a stronger US dollar and higher bond yields.
Chart 1: Firming after sharp fall
End-of-month LBMA Gold Price PM and MCX domestic spot price m/m changes and price level*
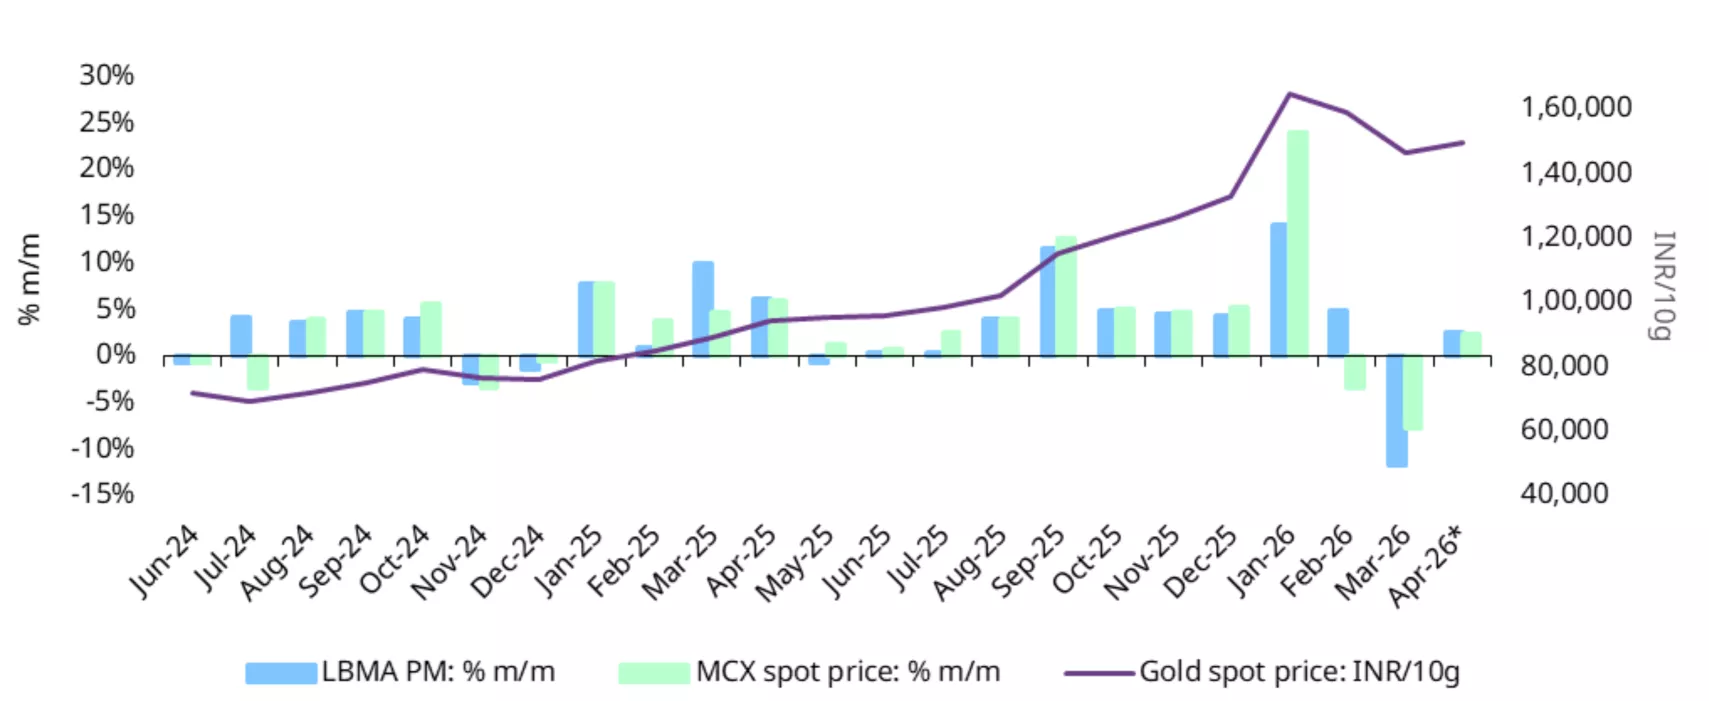
*Based on the LBMA Gold Price PM in USD and MCX spot gold price as of 13 April 2026.
Source: Bloomberg, World Gold Council.
As of 13 April, prices had partially recovered and stabilised, although remained more than 13% below the January peak (Chart 1).3 The rebound has been supported by the persistent geopolitical risk premium, a softer US dollar and a pickup in inflows into global ETFs. On a y-t-d basis, gold prices remain elevated, up 8% at US$4,722/oz and 13% at INR 149,494/10g.4
Domestic gold prices, which had been trading at a sustained discount to international prices since mid-February, saw discounts widen further in March – from an average of US$15/oz to US$46/oz. Discounts have since narrowed significantly, averaging ~US$8/oz over the first two weeks of April.
The narrowing is attributed to tighter supply conditions following curbs on imports of platinum alloys (containing more than 1% gold by weight), along with broader restrictions on gold, silver, and platinum jewellery imports.5 In addition, anecdotal reports suggest operational bottlenecks, particularly delays in customs clearance of bullion consignments of nominated banks, further tightened supply.
Chart 2: Discounts narrow
NCDEX gold premium/discount relative to the international price*
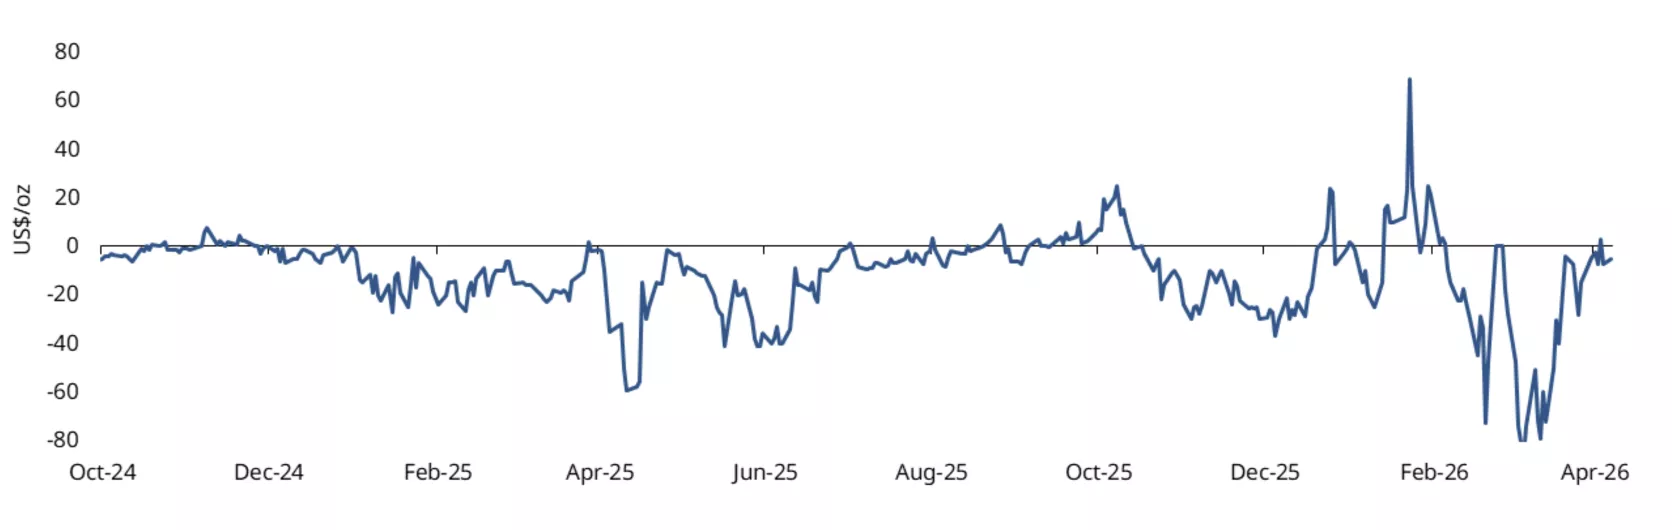
*As of 13 April 2026.
Source: NCDEX, World Gold Council.
Soft jewellery demand
Demand remained muted in the first half of March, impacted by seasonal and financial year-end factors as well as price volatility. Market feedback suggests that purchases were deferred during the price spike. However, as prices eased around regional festivals, demand improved but was overall subdued. Retailers focused on marketing campaigns and promotional offers to drive sales. Exchange of old gold jewellery remained a key contributor, reportedly accounting for 40–50% of sales, while investment demand for bars and coins continued to be robust.
Strong Q1 2026 for listed jewellers
Listed jewellery retailers6 delivered a strong performance in Q1 2026 (Jan–Mar), with revenue growth ranging from 32% to 124% y/y, making it the best quarter of the financial year for several retailers. Growth was driven by a robust wedding season and steady discretionary demand, which remained resilient despite the elevated and volatile gold prices. Regional festivals also supported sales. Retailers also benefited from an increase in the average ticket size of purchases, growth in plain gold jewellery, and a sharp rise in coin sales. Additionally, digital channels continued to gain traction, with some jewellers reporting over a fourfold y/y growth in online revenues.
Retailers continued their expansion push, adding between 7 to 38 stores during the quarter, although some launches were delayed due to geopolitical supply disruptions. Most retailers have indicated plans to continue expanding their store network, reflecting confidence in long-term demand and a focus to deepen market presence.
Overall, the quarter highlighted strong domestic demand resilience alongside strategic growth initiatives.
Gold ETFs: redemptions weigh on net inflows
Despite significant redemptions and in contrast with the trend of North American and European ETFs, Indian gold ETFs extended their inflow streak to the 11th consecutive month in March 2026, recording net inflows of INR 22.7bn (US$244mn) as per data from the Association of Mutual Funds of India (AMFI), above our initial estimate.7 This, however, was the lowest monthly net inflow in seven months (Chart 3). The moderation was primarily driven by record redemptions of INR 31.6bn (US$341mn), likely reflecting continued profit-taking, a trend carried forward from February. Nevertheless, cumulative gold holdings rose to 115t as of end March, in line with our initial estimates, indicating underlying resilient demand.
Following the relative weakness in March, April has seen a recovery in flows. During 1–10 April, net inflows stood at INR 17.36bn (US$187mn), contributing an additional 1.2t to collective holdings.
Q1 2026 recorded the strongest quarterly inflows into Indian gold ETFs, with net inflows of INR 316bn (US$3.45bn), resulting in an addition of approximately 20t to total holdings. Notably, nearly 80% of these inflows were concentrated in January, reflecting strong investor sentiments amid the rally in gold prices.
The investor interest in gold ETFs has been sustained and continues to broaden, albeit at a slower pace, as reflected in the number of accounts or folios of gold ETFs. March saw the addition of 0.31mn new accounts (vs 0.65mn in February), taking the total number to 12.39mn. Furthermore, gold ETFs’ share in the overall assets under management (AUM) of mutual funds has seen a rise to 2.3% from 0.9% a year ago.
Chart 3: Inflows moderate, holdings maintain uptrend
Gold ETF flows in INRbn, and total holdings in tonnes*
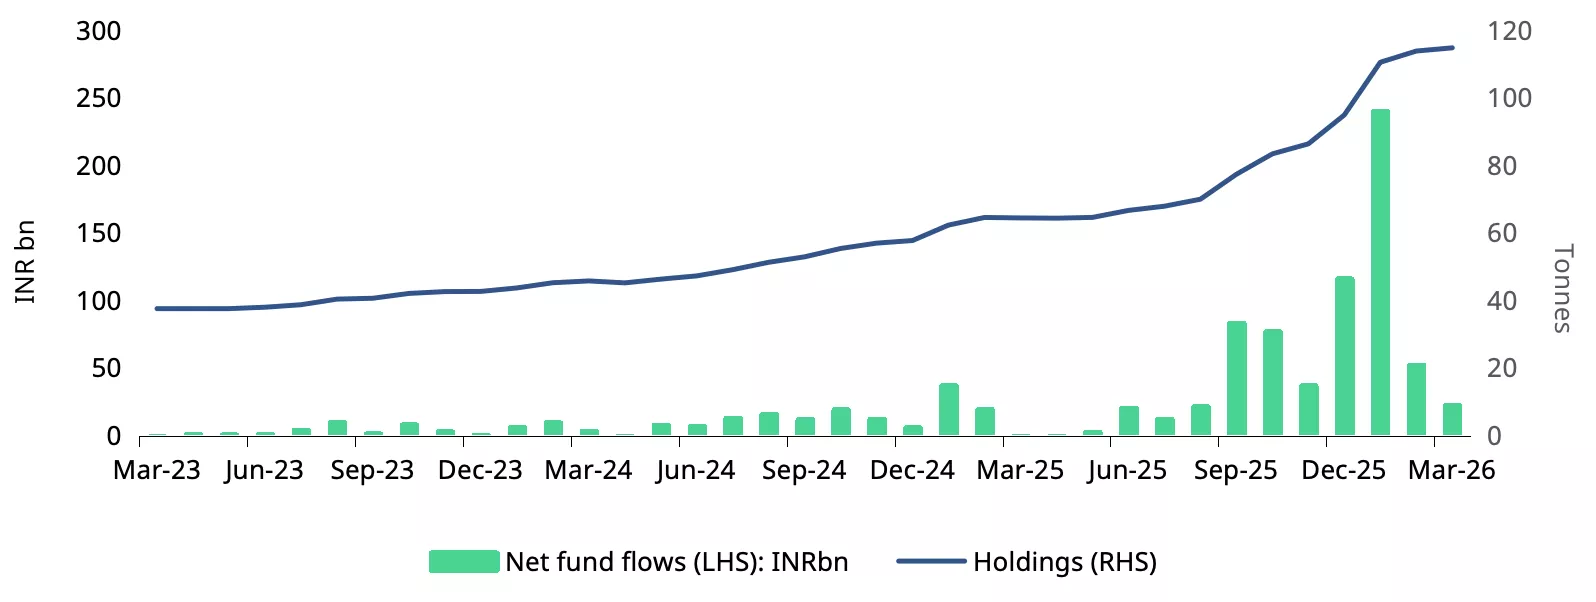
*As of end March 2026.
Source: AMFI, ICRA Analytics, CMIE, World Gold Council
Digital gold sees continued uptake
The purchases of digital gold via the Unified Payments Interface (UPI) remained strong in February, albeit below January’s record levels.8 Total purchases during the month totalled INR 30.3bn, equivalent to an estimated 1.9t (Chart 4) in volume terms, which is 53% higher than the average monthly volume of 1.2t over the preceding 13 months. Although digital gold purchases are currently unregulated, this channel continues to attract retail investors, likely driven by the ease of transactions and low minimum investment requirements. The value of these transactions has increased nearly fourfold over the past year, highlighting the growing need for regulatory oversight.
Chart 4: Purchase momentum sustained
Purchase of digital gold, by value and estimated volume*
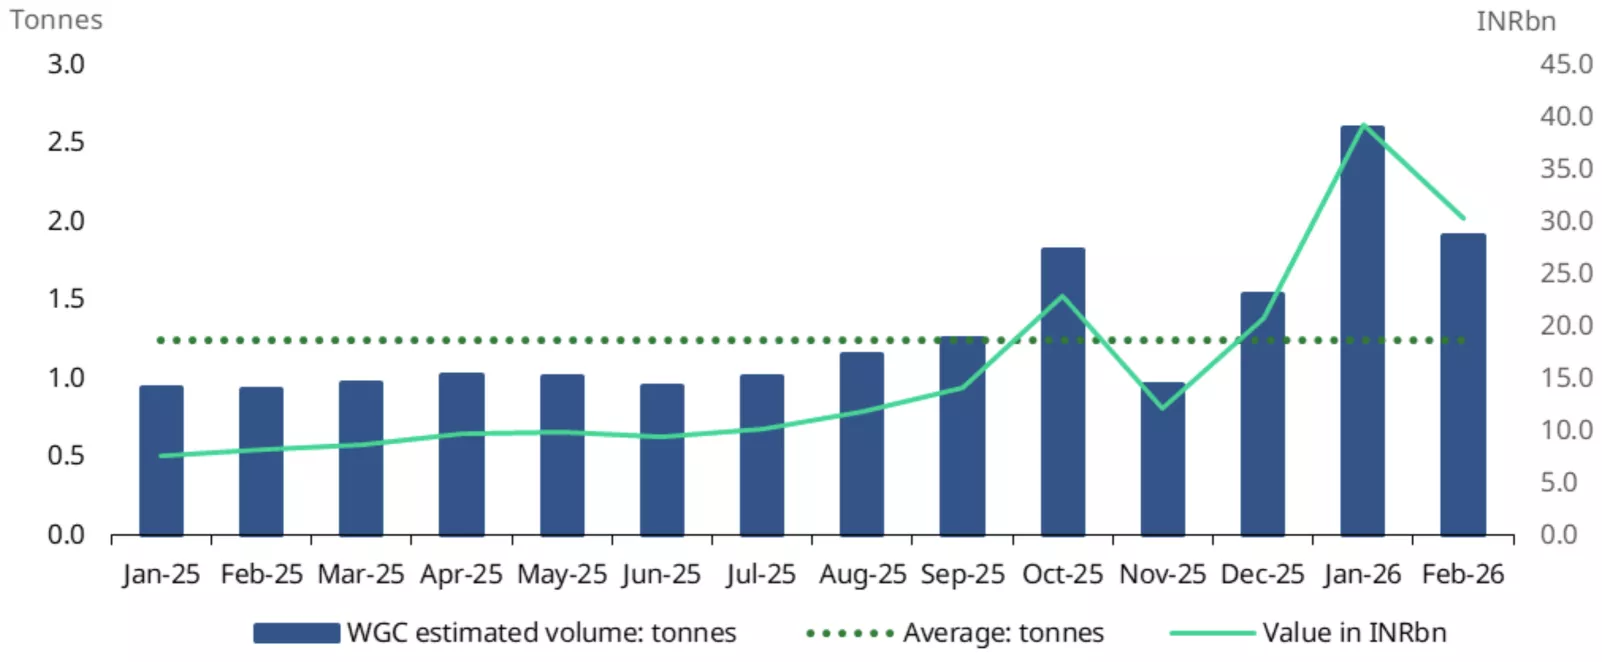
*As of end February 2026.
Source: NPCI, World Gold Council
RBI holding onto gold reserves
Despite a 4% decline in RBI forex reserves to US$697bn over the five weeks to 3 April, its gold holdings have remained largely stable. The RBI added a marginal 0.17t to its gold holdings in the week ending 3 April, taking total gold reserves to 880.5t, accounting for 17% of overall forex reserves, up from 12% a year ago. Gold holdings have broadly remained steady since mid-2025, with the pace of purchases moderating in 2025 (4t) following significant additions in 2024 (73t).
Sharp decline in imports
Gold imports fell sharply in March 2026, declining 30% m/m and 59% y/y to US$3.1bn, a nine-month low. In volume terms, imports are estimated to be 20–25t, well below the 12-month average of 62t. The decline reflects a combination of demand softness and supply disruptions stemming from flight disruptions out of the Middle East, a key transit hub for bullion flows into India.
Chart 5: Imports plunge
Monthly gold imports in tonnes and US$bn*
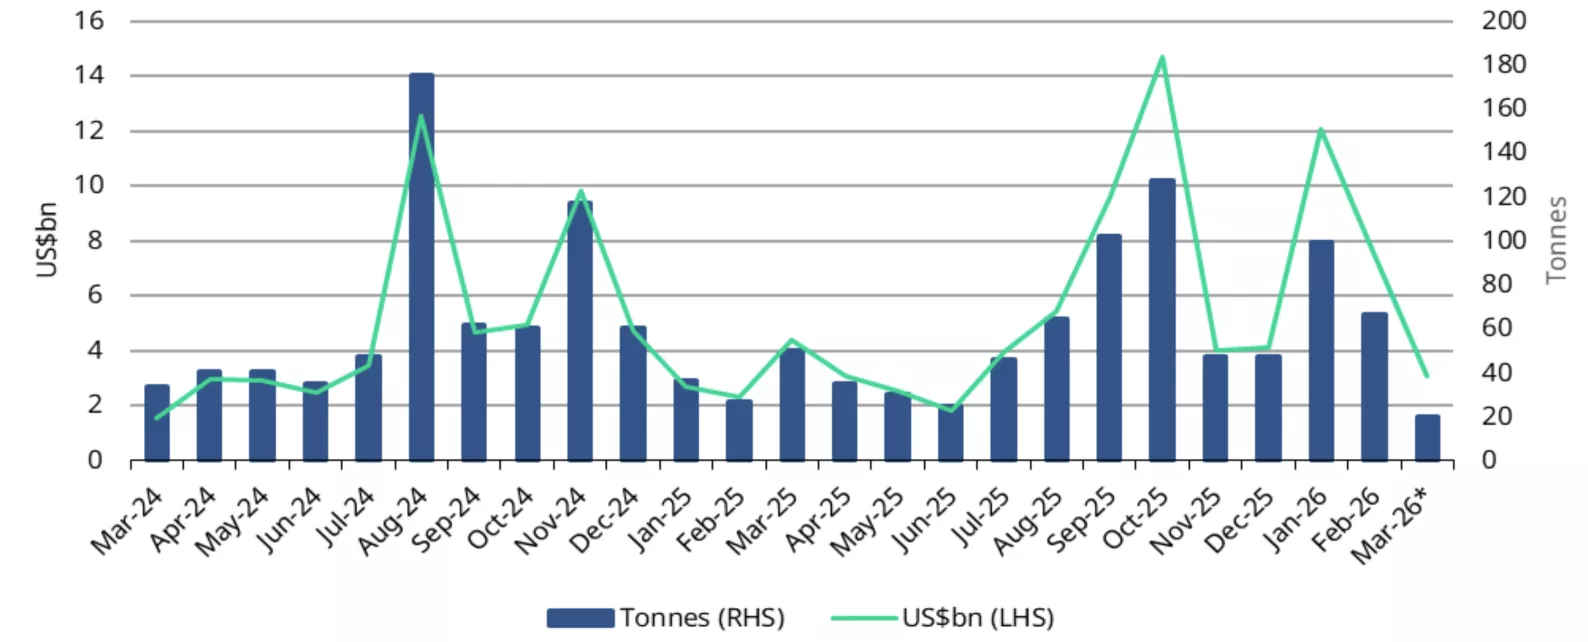
*Includes World Gold Council estimates
Source: Ministry of Commerce and Industry, CMIE, World Gold Council.
Footnotes
1LBMA gold price PM and MCX spot gold price as of 13 April 2026.
2Akshaya Tritiya- 19-20 April 2026.
3LBMA gold price PM.
4LBMA gold price PM and MCX spot gold price as of 13 April 2026.
5Amendment in Import Policy of items covered under Chapter 71 of ITC (HS)2022, 02 April 2026
6Titan Company, Senco Gold Ltd, Kalyan Jewellers India Ltd, PC Jeweller Ltd, PN Gadgil Jewellers Ltd.
7AMFI reported March 2026 net inflows (~US$244mn) exceeds our US$177mn,estimated based on partial information.
8Digital gold is a physical gold product that is purchased electronically by customers and held in professionally managed vaults until the customer chooses to sell the gold or take physical delivery. Providers of digital gold include payment applications, jewellers, and online investment platforms.
Disclaimer
Important information and disclaimers
© 2026 World Gold Council. All rights reserved. World Gold Council and the Circle device are trademarks of the World Gold Council or its affiliates.
All references to LBMA Gold Price are used with the permission of ICE Benchmark Administration Limited and have been provided for informational purposes only. ICE Benchmark Administration Limited accepts no liability or responsibility for the accuracy of the prices or the underlying product to which the prices may be referenced. Other content is the intellectual property of the respective third party and all rights are reserved to them.
Reproduction or redistribution of any of this information is expressly prohibited without the prior written consent of World Gold Council or the appropriate copyright owners, except as specifically provided below. Information and statistics are copyright © and/or other intellectual property of the World Gold Council or its affiliates or third-party providers identified herein. All rights of the respective owners are reserved.
The use of the statistics in this information is permitted for the purposes of review and commentary (including media commentary) in line with fair industry practice, subject to the following two pre-conditions: (i) only limited extracts of data or analysis be used; and (ii) any and all use of these statistics is accompanied by a citation to World Gold Council and, where appropriate, to Metals Focus or other identified copyright owners as their source. World Gold Council is affiliated with Metals Focus.
The World Gold Council and its affiliates do not guarantee the accuracy or completeness of any information nor accept responsibility for any losses or damages arising directly or indirectly from the use of this information.
This information is for educational purposes only and by receiving this information, you agree with its intended purpose. Nothing contained herein is intended to constitute a recommendation, investment advice, or offer for the purchase or sale of gold, any gold-related products or services or any other products, services, securities or financial instruments (collectively, “Services”). This information does not take into account any investment objectives, financial situation or particular needs of any particular person.
Diversification does not guarantee any investment returns and does not eliminate the risk of loss. Past performance is not necessarily indicative of future results. The resulting performance of any investment outcomes that can be generated through allocation to gold are hypothetical in nature, may not reflect actual investment results and are not guarantees of future results. The World Gold Council and its affiliates do not guarantee or warranty any calculations and models used in any hypothetical portfolios or any outcomes resulting from any such use. Investors should discuss their individual circumstances with their appropriate investment professionals before making any decision regarding any Services or investments.
This information may contain forward-looking statements, such as statements which use the words “believes”, “expects”, “may”, or “suggests”, or similar terminology, which are based on current expectations and are subject to change. Forward-looking statements involve a number of risks and uncertainties. There can be no assurance that any forward-looking statements will be achieved. World Gold Council and its affiliates assume no responsibility for updating any forward-looking statements.
Information regarding the LBMA Gold Price
The LBMA Gold Price is used by the World Gold Council with permission under license by ICE Benchmark Administration Limited and is subject to the restrictions set forth
Information regarding QaurumSM and the Gold Valuation Framework
Note that the resulting performance of various investment outcomes that can be generated through use of Qaurum, the Gold Valuation Framework and other information are hypothetical in nature, may not reflect actual investment results and are not guarantees of future results. Neither World Gold Council (including its affiliates) nor Oxford Economics provides any warranty or guarantee regarding the functionality of the tool, including without limitation any projections, estimates or calculations.
Information from ICRA Analytics Limited
All information obtained from ICRA Analytics Limited contained in this document is subject to the disclaimer set forth here (www.icraanalytics.com/terms-of-use/disclaimer).
