Key highlights:
- Gold’s price divergence continued: the Shanghai Gold Price Benchmark PM (SHAUPM) in RMB rose by 1%, while the LBMA Gold Price AM in USD saw a 2% fall in October
- The average Shanghai-London gold price premium remained elevated in October but fell during the second half of the month as COVID-related uncertainty clouded local gold demand prospects1
- Seasonal weakness and COVID-related disruptions weighed on October’s gold withdrawals from the Shanghai Gold Exchange (SGE), leading to an 81t fall m-o-m
- The total assets under management (AUM) in Chinese gold ETFs reached 52t (US$3bn, RMB20bn) by the end of October, an outflow of 6t (US$331mn, RMB2bn) in the month.2
Looking ahead:
- Positive seasonality linked to the Chinese New Year and gold’s appeal as a value-preserving asset should provide some support for local gold demand in coming months.
- However, COVID disruptions may continue to limit gold consumption as the possibility of future lockdowns can’t be ruled out
The monthly average local gold price premium stayed elevated
The RMB gold price continued to show resilience in October. While the strong US dollar and rising yields continued to weigh on the LBMA Gold Price AM in USD, the SHAUPM in RMB remained stable amid a weakening local currency.
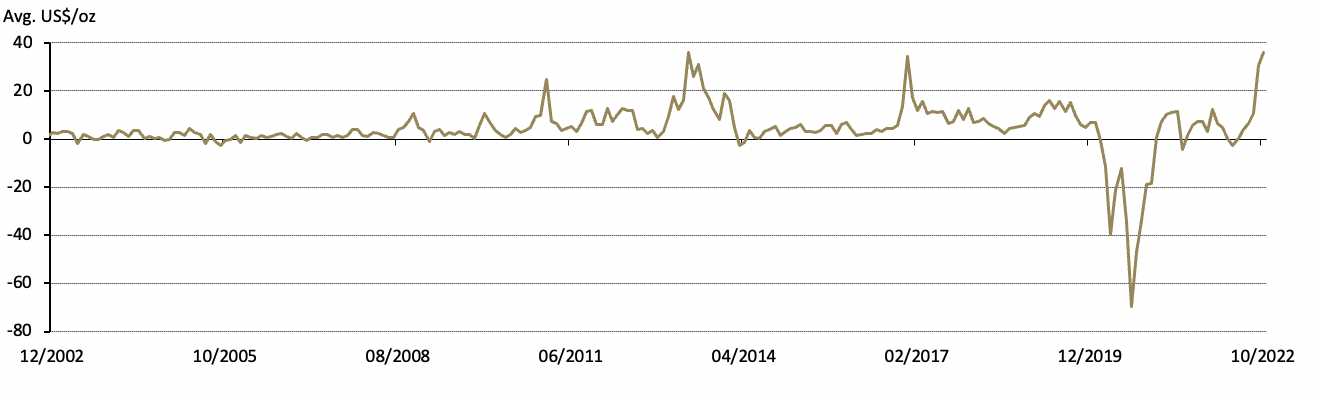
The monthly average local gold price premium remained elevated (Chart 1). As noted in a recent blog, robust gold demand has been driving up the local gold premium recently. And as October kicks off the traditional peak season for gold demand, optimistic expectations played a key role in pushing the month’s average premium up to US$36/oz, on a par with the record level of May 2013.
We believe the general tightness in the local physical gold market also played a key role. This is evidenced by the fact that local gold consumption has seen a much faster recovery than local gold production since Q1 2020. And analysis suggests that the imbalance between local demand and supply has a measurable impact on the local gold price premium, as shown by our spread model.
Chart 1: The local gold price premium reached its previous record
The average monthly spread between SHAUPM and LBMA Gold Price AM in US$/oz*
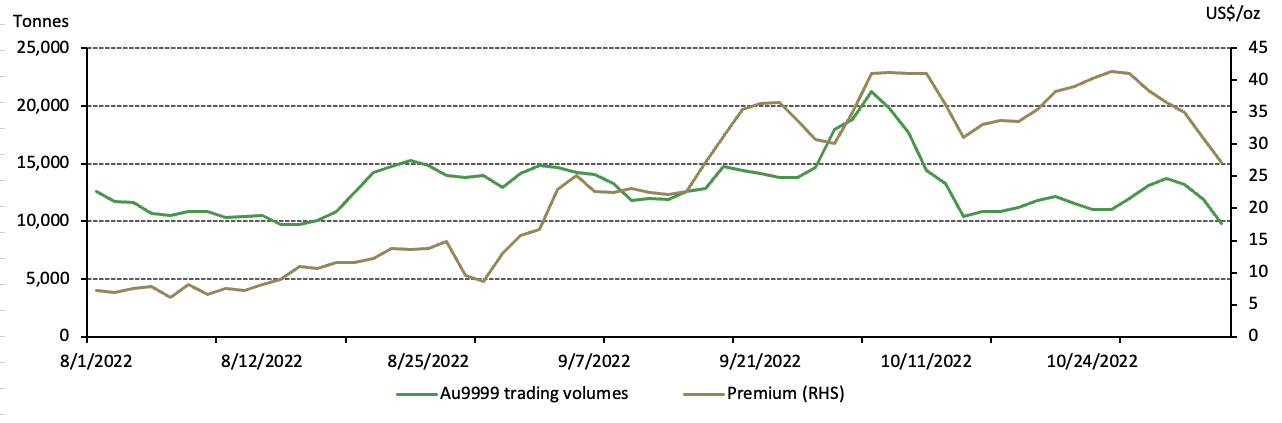
The local gold price premium, however, lost some momentum in mid-late October (Chart 2). This was likely due to concerns that recent COVID resurgences and potential lockdowns may dent China’s gold demand. And this was also reflected in weaker-than-usual October gold withdrawals from the SGE (see details below).
Chart 2: The daily local gold price premium closely matches local demand
Five-day rolling average of local premium and Au9999 trading volumes*
Wholesale gold demand fell
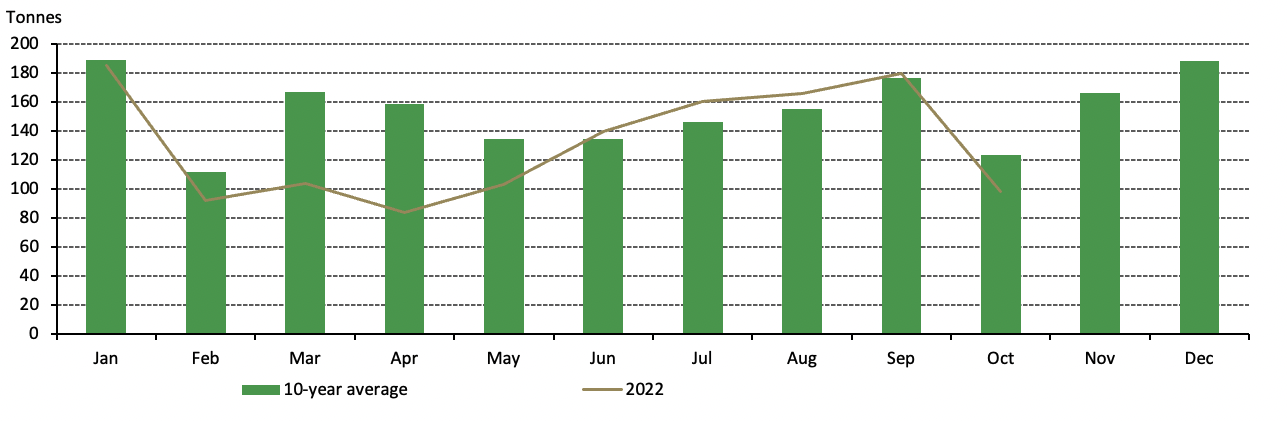
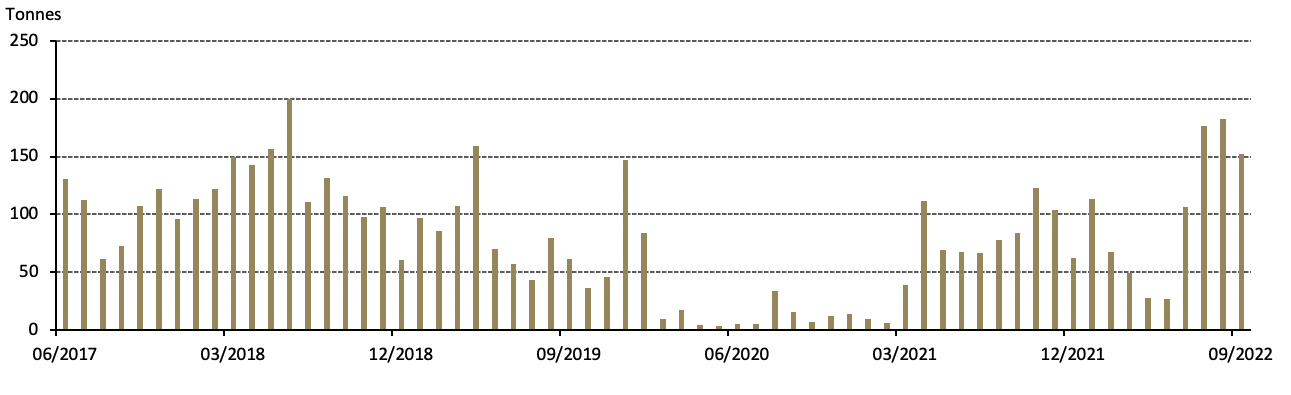
SGE gold withdrawals totalled 98t in October, an 81t decline m-o-m and a reflection of seasonal patterns (Chart 3). Manufacturers actively replenish gold in September ahead of the traditional peak gold consumption season, and this usually leads to lower wholesale gold demand in October.
Chart 3: Wholesale gold demand saw a seasonal m-o-m fall in October
Monthly gold withdrawals from the SGE
On a y-o-y basis, October’s gold withdrawals were 38t lower. The y-o-y weakness is likely due to COVID-related restrictions in many regions including Guangdong province – the gold manufacturing hub of China – during the month.3
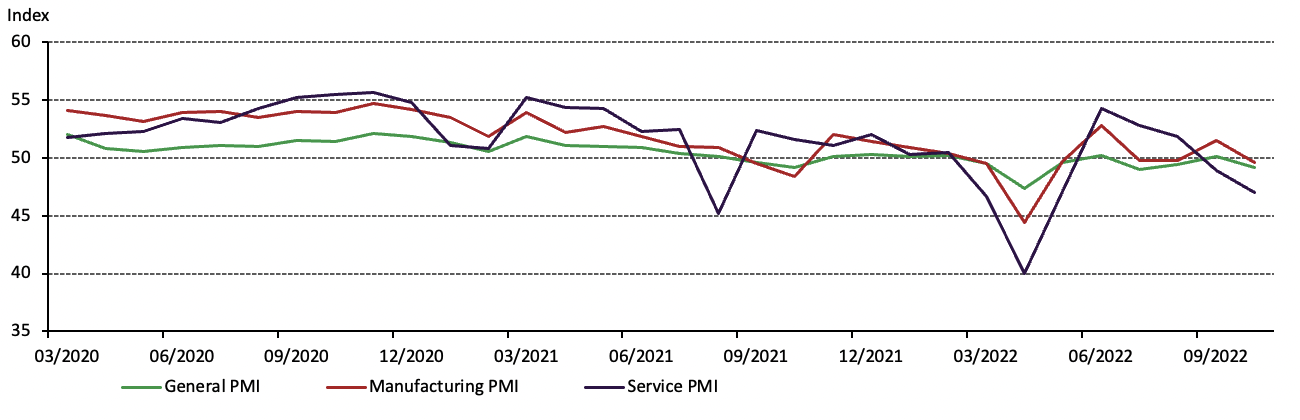
China’s economy during October also tumbled as COVID disruptions hit. Early economic indicators show that while China’s exports unexpectedly declined, the nation’s manufacturing and non-manufacturing Purchase Managers’ Index (PMIs) fell below 50 – into the contraction zone – in October (Chart 4).4
Chart 4: The COVID resurgence and related restrictions have dented local economic activities
Chinese gold ETF holdings continued to see outflows
Outflows from Chinese gold ETFs accelerated, losing 6t (US$331mn, RMB2bn) in October. Total holdings stood at 52t (US$3bn, RMB20bn) by the end of the month, the lowest since March 2020.
The AUM in Chinese gold ETFs has exhibited a strong negative correlation with the local gold price – the tactical approach of local investors to “buy low and sell high” may be a key driver here (Chart 5). And as the local gold price capped another monthly gain, investors may have taken profits on their previous holdings, leading to net outflows during the month.
Chart 5: Chinese gold ETF holdings lost 6t in October
Daily Chinese gold ETF holdings and close of Au9999 price
Gold imports remained elevated in September
Despite a 30t m-o-m drop, September gold imports into China stayed strong at 152t, significantly higher than previous years (Chart 6). Elevated wholesale physical gold demand and the local gold price premium during the month might be main contributors.
Chart 6: China’s gold imports in September were strong
China’s gold imports under HS7108*
Looking ahead
COVID-related uncertainty will remain a key risk factor to China’s gold demand during Q4. This uncertainty was apparent in the uneven gold consumption across different cities during the National Day holiday, as mentioned in our previous blog, and has led to the lower wholesale gold demand and weaker economic growth we have seen during October.
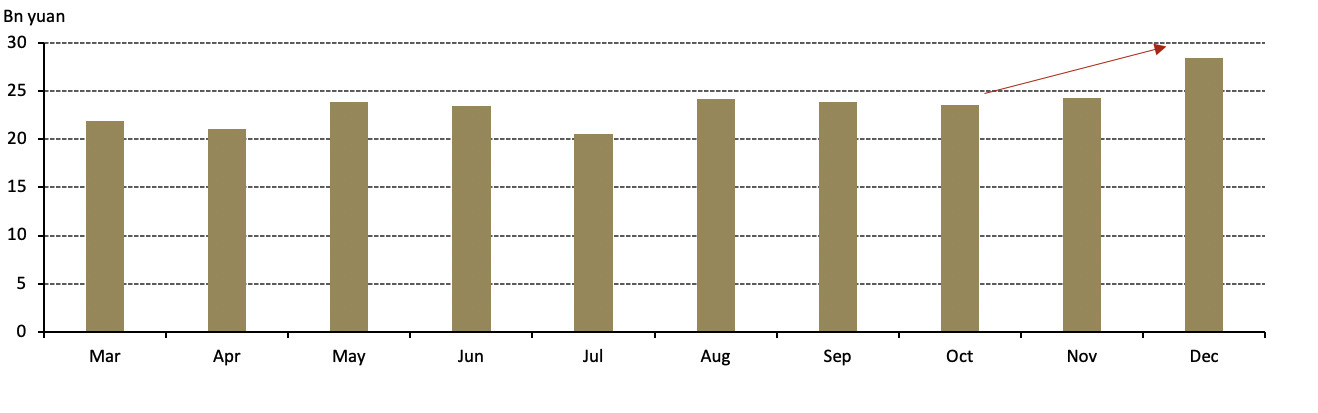
Nonetheless, seasonality suggests that both retail (Chart 7) and wholesale gold demand (Chart 3) should rise as we approach the year end. This will be driven primarily by consumer gifting demand ahead of the Chinese New Year’s holiday, which occurs in January. The local currency volatility and various uncertainties should continue to help boost gold’s popularity as a value-preservation asset, benefiting local gold consumption.
Chart 7: Jewellery retail sales tend to pick up towards the end of the year
Average monthly jewellery retail sales (gold, silver, gem and others) during the past 10 years in bn yuan*
Footnotes
We compare the LBMA Gold Price AM to SHAUPM because the trading windows used to determine them are closer to each other than those for the LBMA Gold Price PM. For more information about Shanghai Gold Benchmark Prices, please visit Shanghai Gold Exchange.
Please note that the inflow/outflow value term calculation is based on the tonnage difference between end-of-period assets under management, the end-of-period Au9999 prices in RMB and the USD/CNY exchange rate.
For more, see: New Travel Policies in Shenzhen and Restrictions in Guangzhou – That’s Guangzhou (thatsmags.com)
For more, see: China trade down on weak global demand, virus curbs | AP News; and China's services activity skids in October on COVID restrictions - Caixin PMI | Financial Post