Key highlights:
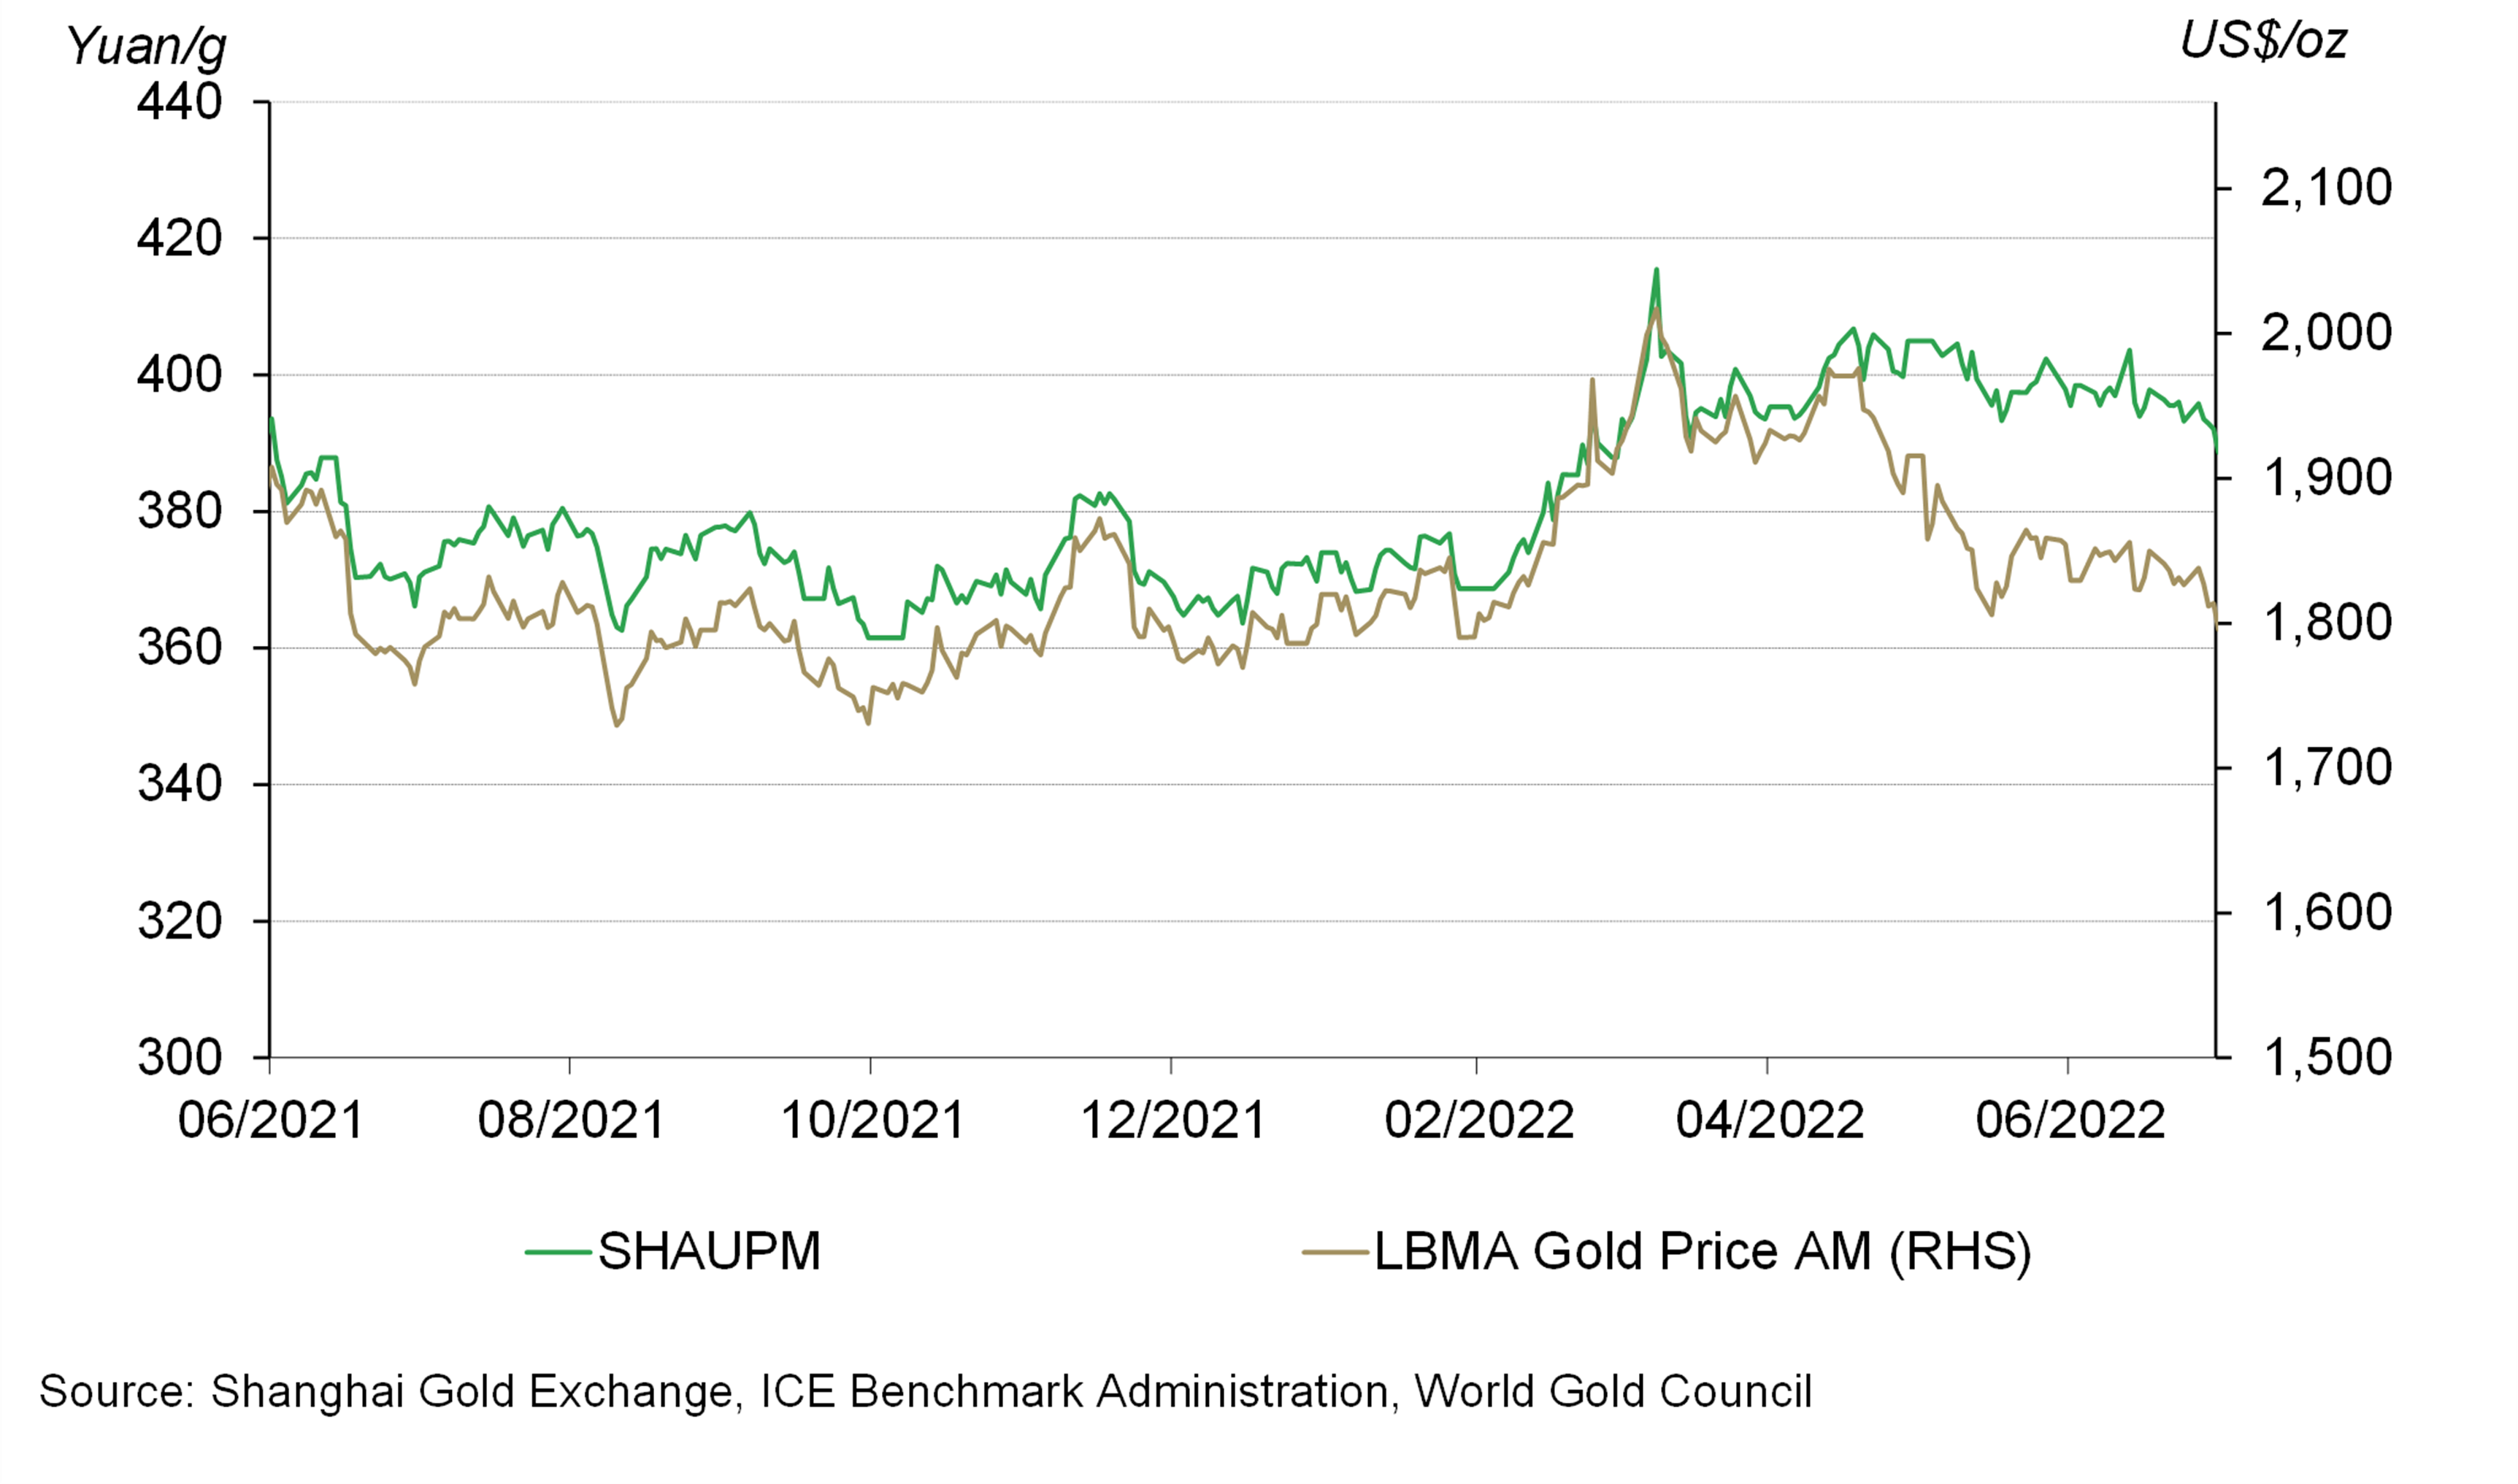
- The Shanghai Gold Price Benchmark PM (SHAUPM) in RMB and LBMA Gold Price AM in USD both trended down in June. Y-t-d, a weaker local currency has led to a stronger RMB gold performance than in USD
- Despite another rebound last month, the average Shanghai-London gold price spread during H1 2022 was markedly lower than in previous years 1
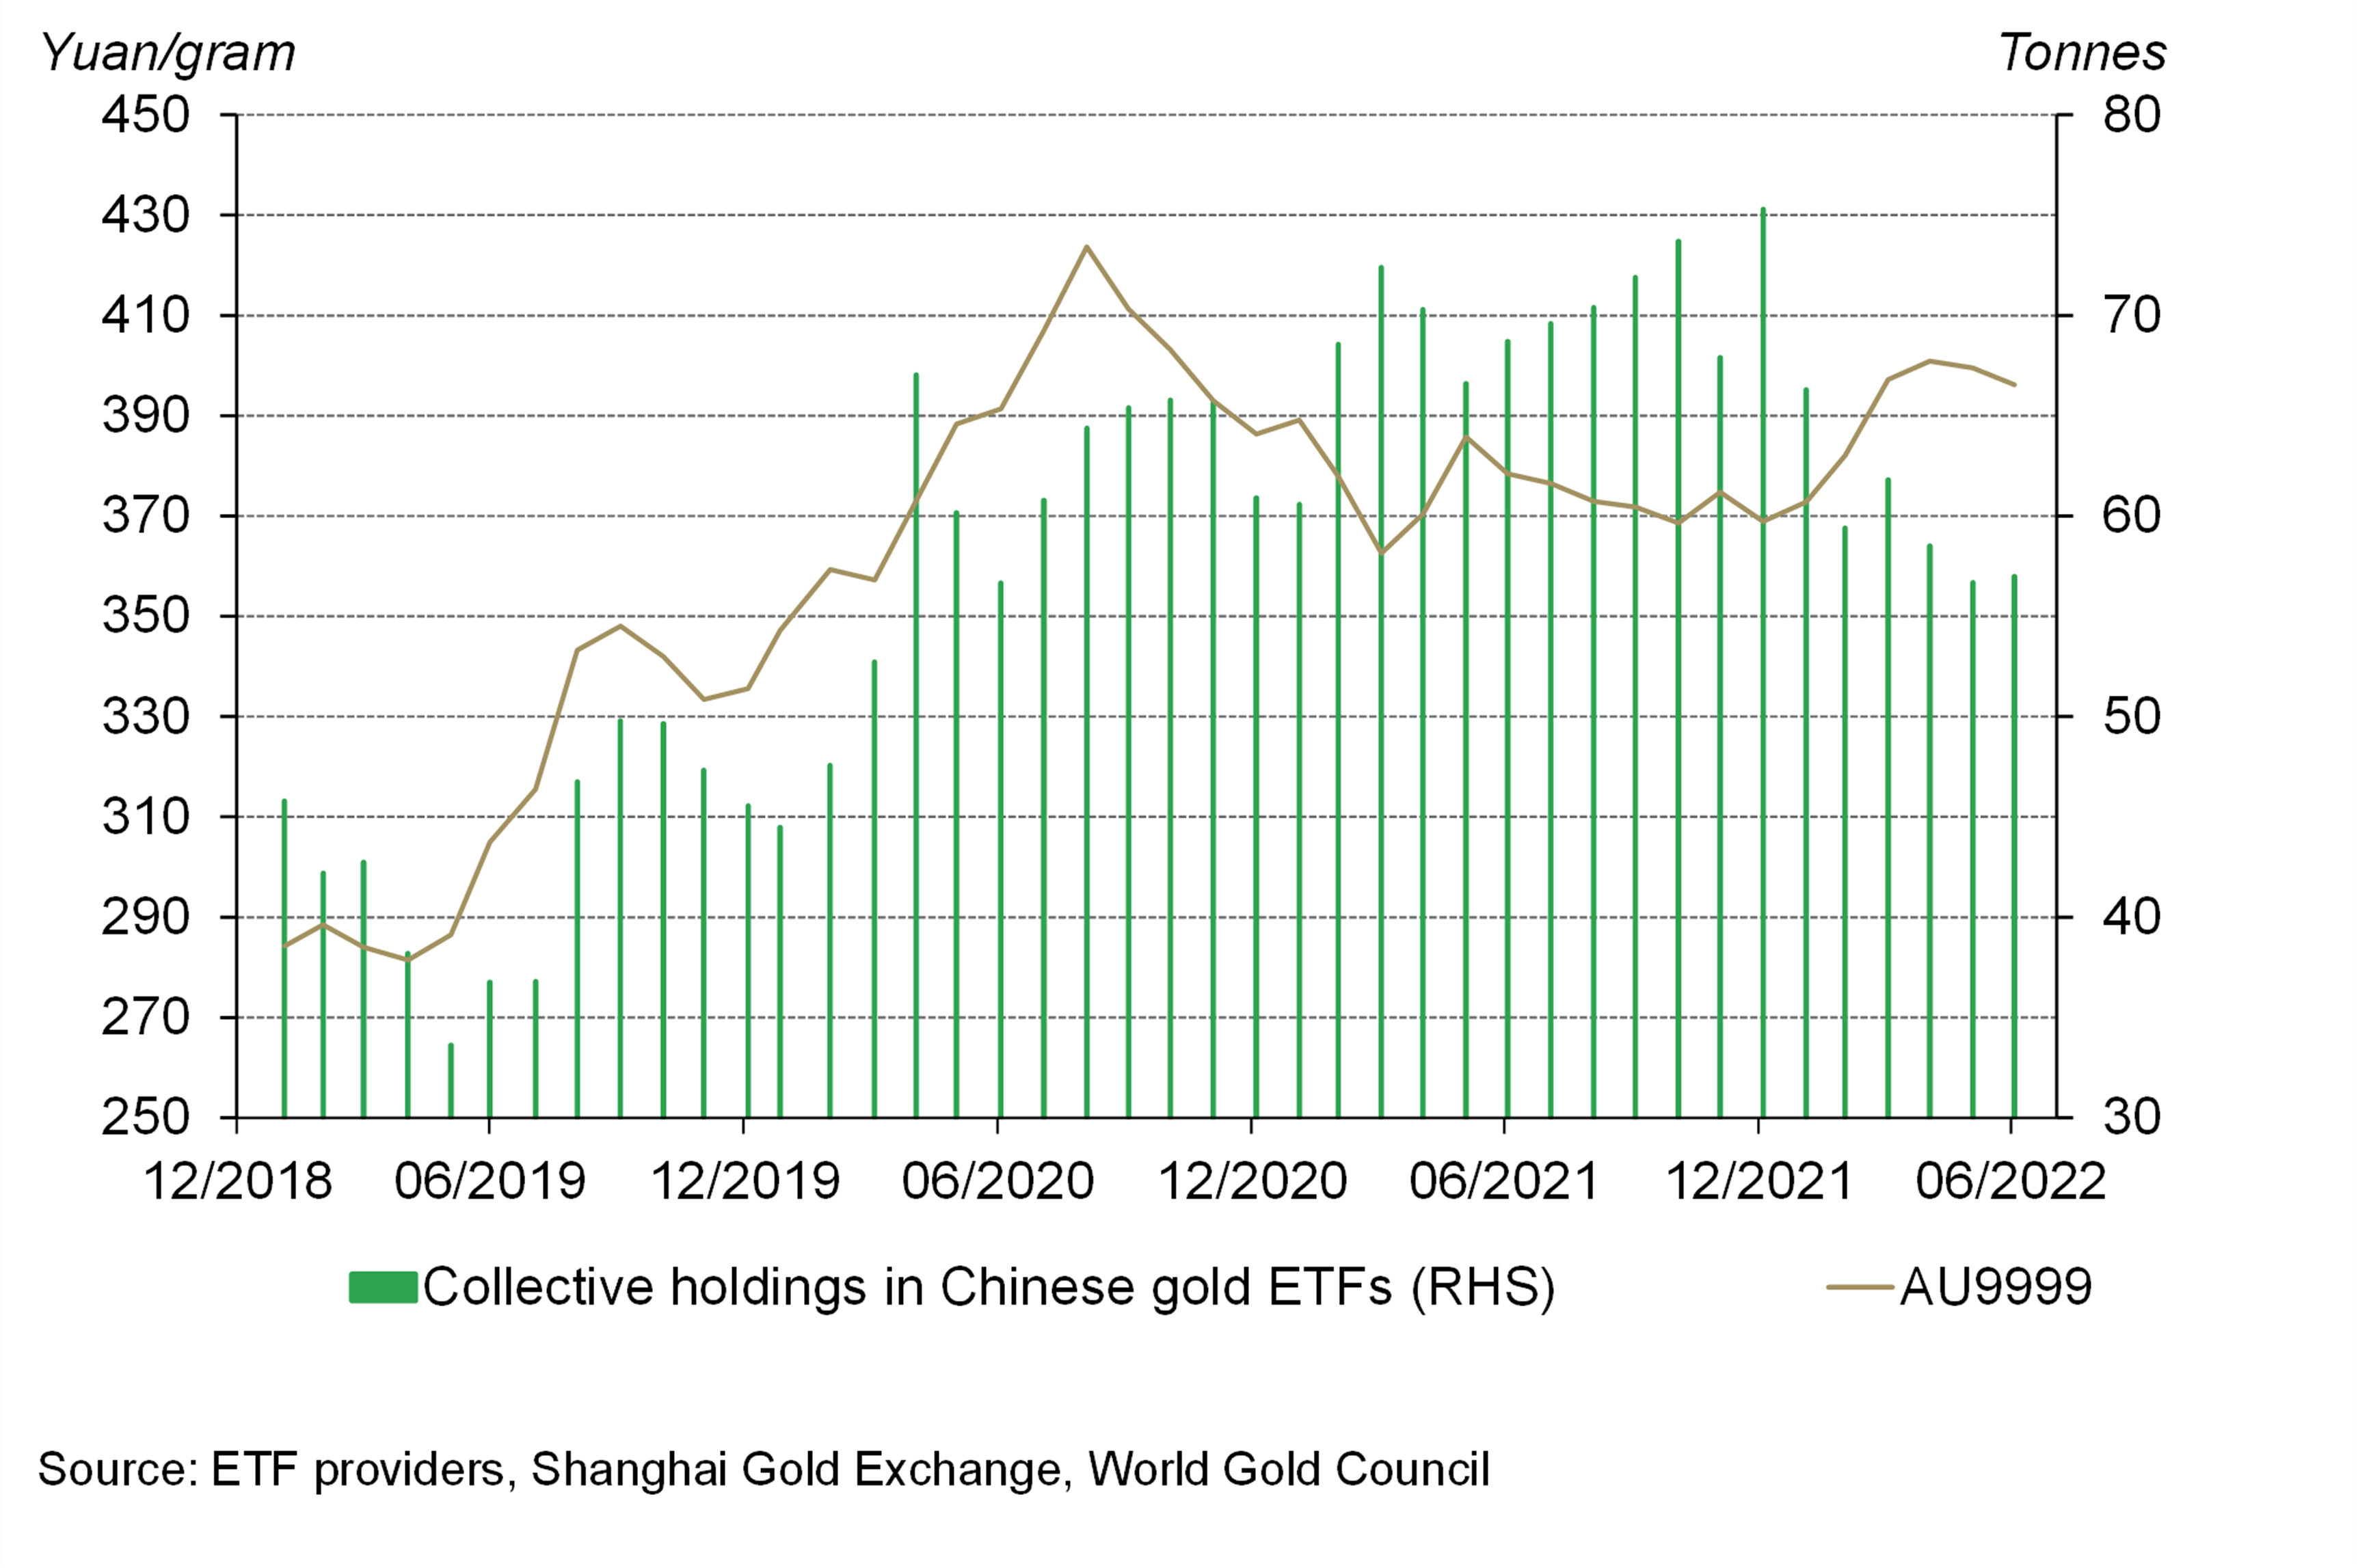
- Chinese gold ETFs saw a 0.3t (-US$37mn, -RMB 73mn) inflow in June, leading to an 18.3t (US$1bn, RMB5.2bn) net outflow during the first half2
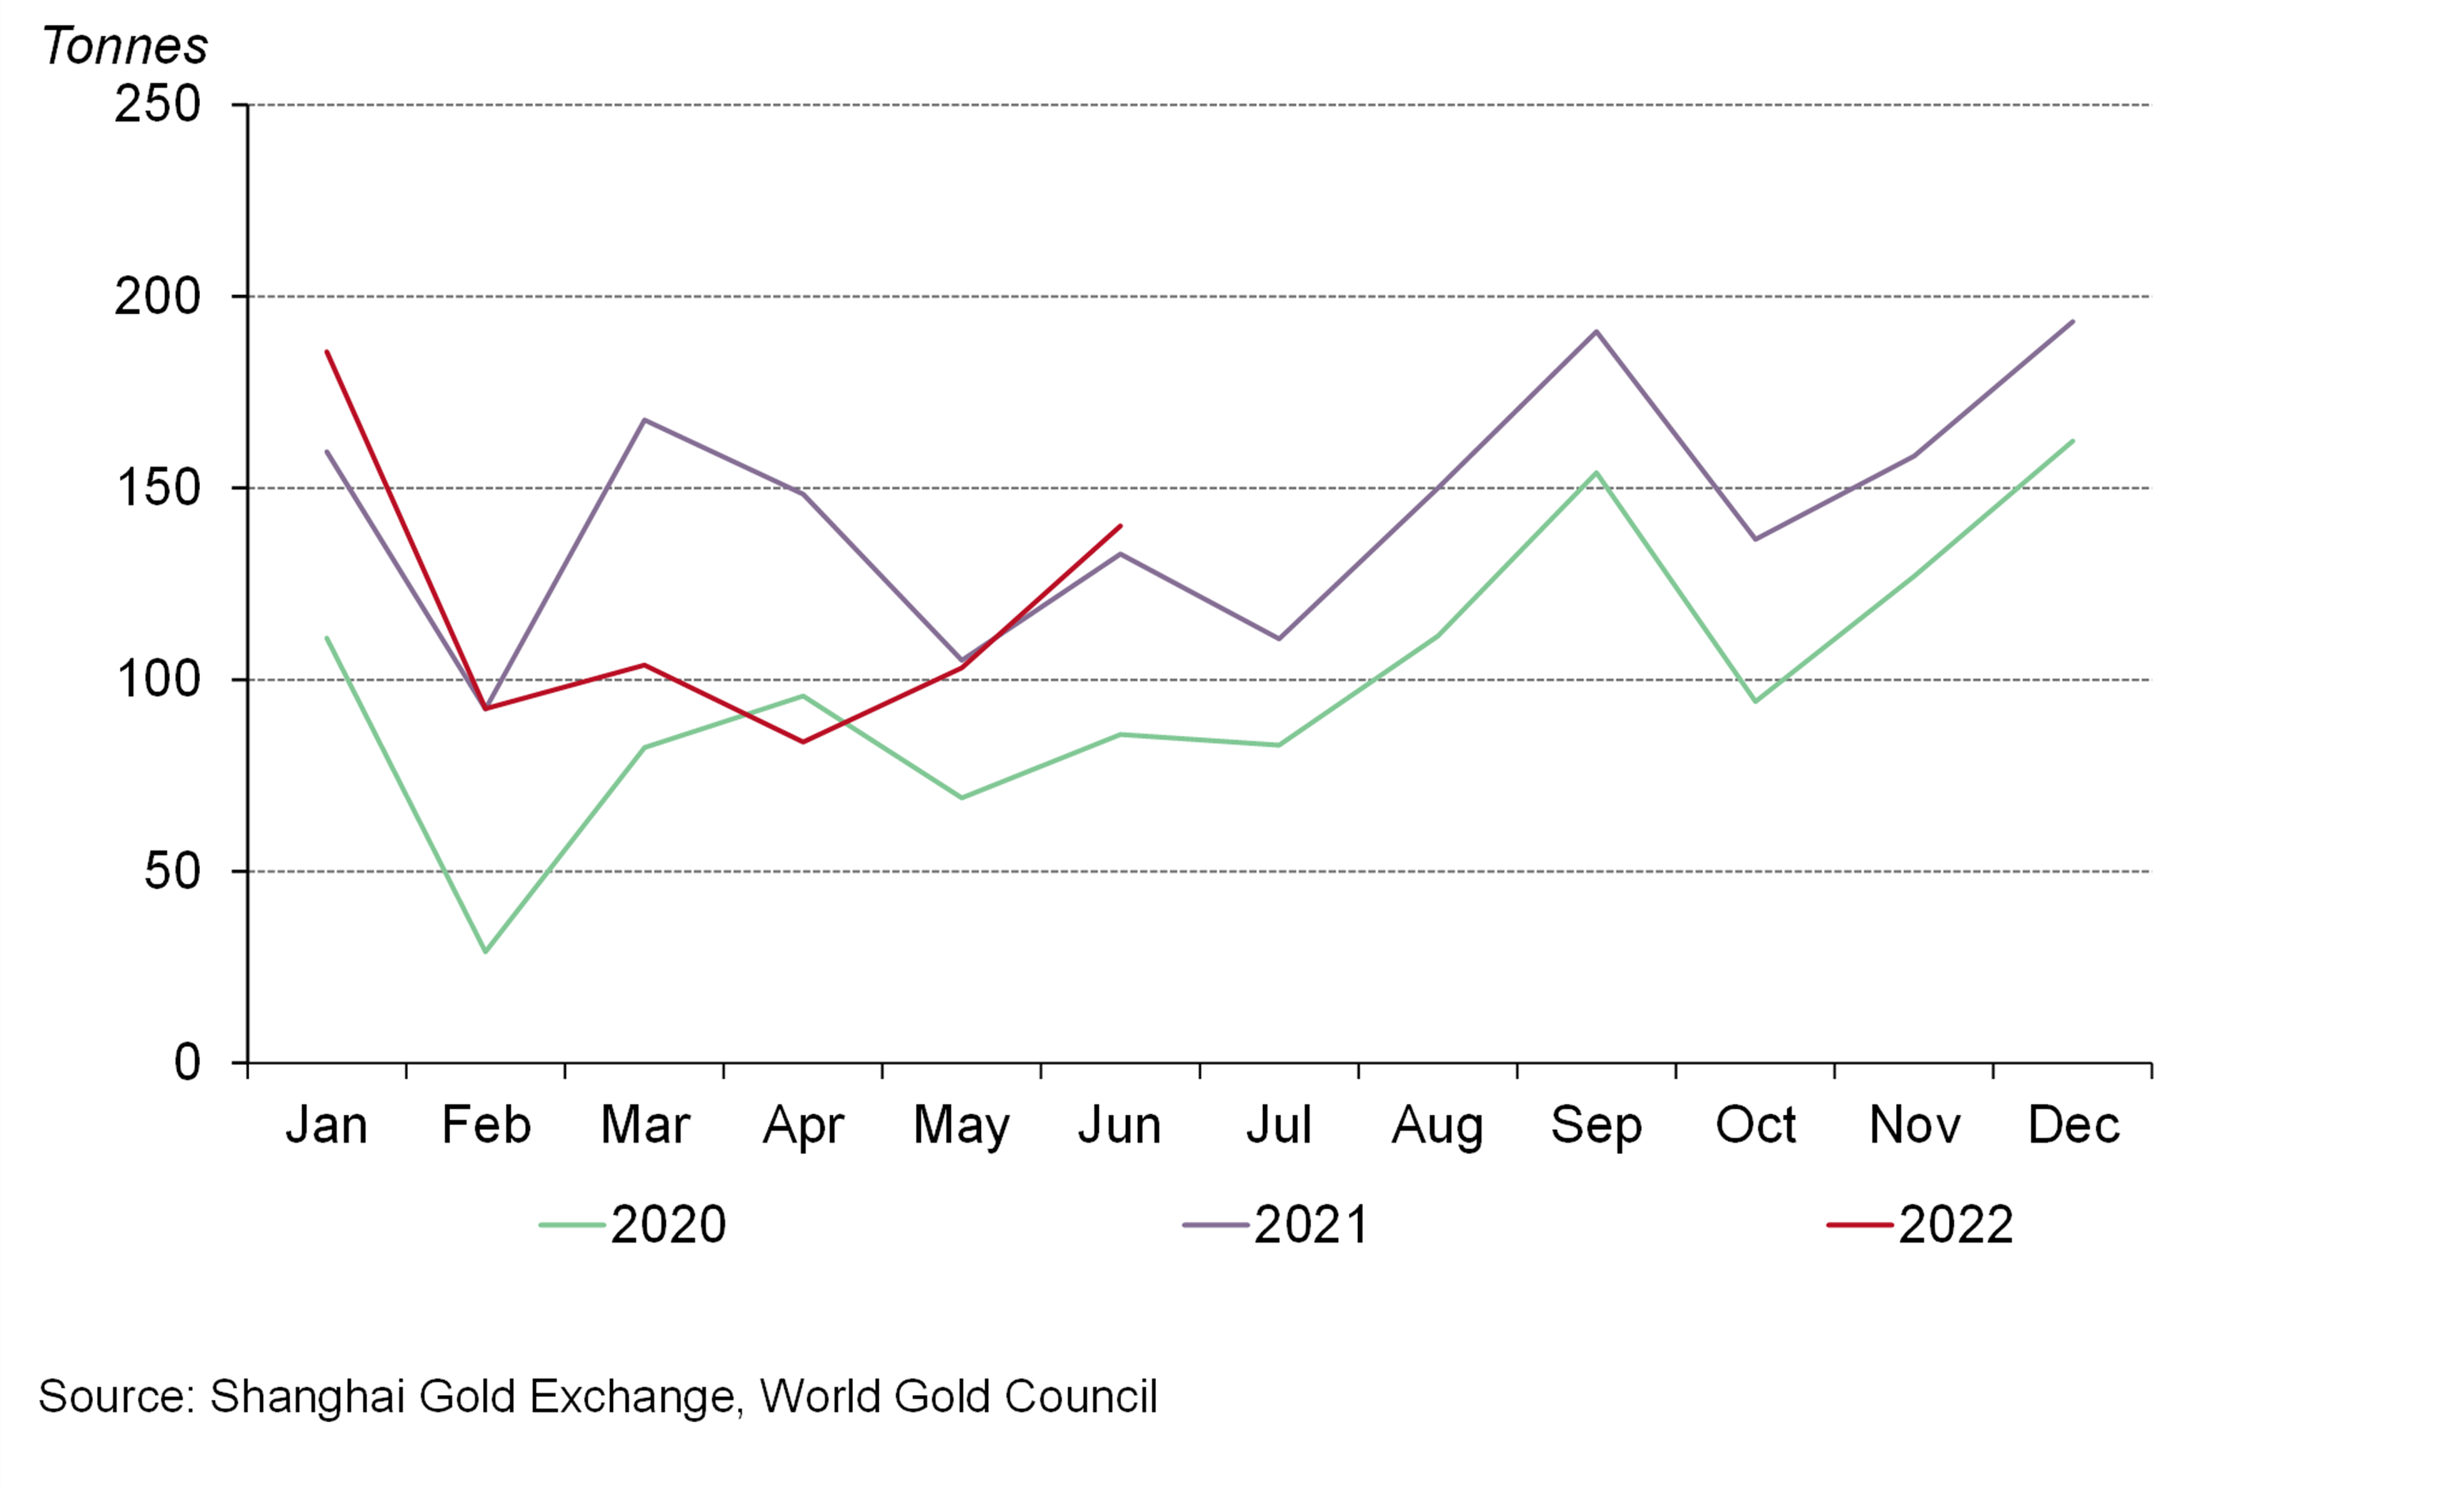
- As local economic activities continued to improve, gold withdrawals from the Shanghai Gold Exchange (SGE) extended their recovery in June. But total withdrawals in H1 2022 registered a 12% y-o-y decline due to COVID disruption.
Looking ahead:
- Although a potential economic slowdown may exert pressure, consumption stimuli from the government, pent-up wedding demand and a weak RMB, among other factors, could provide support for Chinese gold consumption in the second half.
The divergence in RMB and USD gold price performances lasted throughout H1
Gold prices fell further in June as shifting inflation expectations and interest rate rises in key markets weighed on gold. The SHAUPM in RMB saw a 1.3% decline in June and LBMA Gold Price AM in USD fell by 2.2%. RMB gold’s strength relative to its USD peer was more pronounced during H1 2022: RMB gold registered a 5.4% rise while the gold price in USD saw a 0.4% fall. A depreciating Chinese currency against the dollar has been the primary driver for such divergence.
The RMB Gold Price had a Stronger H1 than it's USD Peer
The local gold price spread rose further in June
The local gold price premium continued to rise in June, averaging US$3.4/oz. With major Chinese cities emerging from COVID-related lockdowns, wholesalers’ gold demand improved in line with expectations for local gold consumption, leading to a US$3/oz m-o-m increase in the average Shanghai-London gold price spread.
However, the COVID resurgence in key Chinese cities between March and June significantly weakened local gold demand and suppressed the average spread during the first half. The average Shanghai-London gold price spread of US$2.1/oz in H1 was US$4/oz lower y-o-y, a reduction of US$11/oz compared to the pre-pandemic level of H1 2019.
The local gold price spread continued it's rebound in June
*Before April 2014 the spread calculation was based on Au9999 and LBMA Gold Price AM; click here for more.
Local investor interest in gold ETFs remained tepid
Total holdings in Chinese gold ETFs remained virtually flat at 57t (US$3.4bn, RMB22.6bn) in June. Local investors’ interest in gold ETFs might have been limited by:
- equity market strength; the CSI300 index experienced its largest monthly gain since July 2020 amid improved domestic economic activity
- reduced tactical positioning due to lower gold price volatility.
During the first half of 2022, there was an 18.3t (US$1bn, RMB5.2bn) outflow from Chinese gold ETFs. While the bulk of outflows (13.5t) occurred in Q1, 4.8t were lost in the second quarter. The lack of price volatility in the quarter possibly reduced gold’s allure to tactical investors. Meanwhile, a rise in the local gold price in April may have also led to investors taking profit on their holdings.
A strong local gold price propelled profit-taking during H1 2022
Wholesale physical gold demand continued to improve
Gold withdrawals from the SGE totalled 140t in June, a 37t improvement from May and 7t higher y-o-y. China’s economy showed promising signs of recovery amid fewer COVID-related restrictions and accommodative policies; June’s manufacturing Purchasing Managers Index (PMI) rebounded to the highest level since last March. Consequently, local manufacturers’ and banks’ expectations of future gold consumption continued to improve, leading to higher gold withdrawals in the month. And the y-o-y increase could be a reflection of the industry’s pent-up inventory stocking demand since March, when mobility restrictions were implemented in major cities to prevent the resurgence of COVID.
In the first half, Chinese gold manufacturers and banks withdrew 709t of gold, 12% lower than 2021 primarily due to the unexpected disruption from the COVID recurrence in Q2.
Wholesale gold demand continues to recover
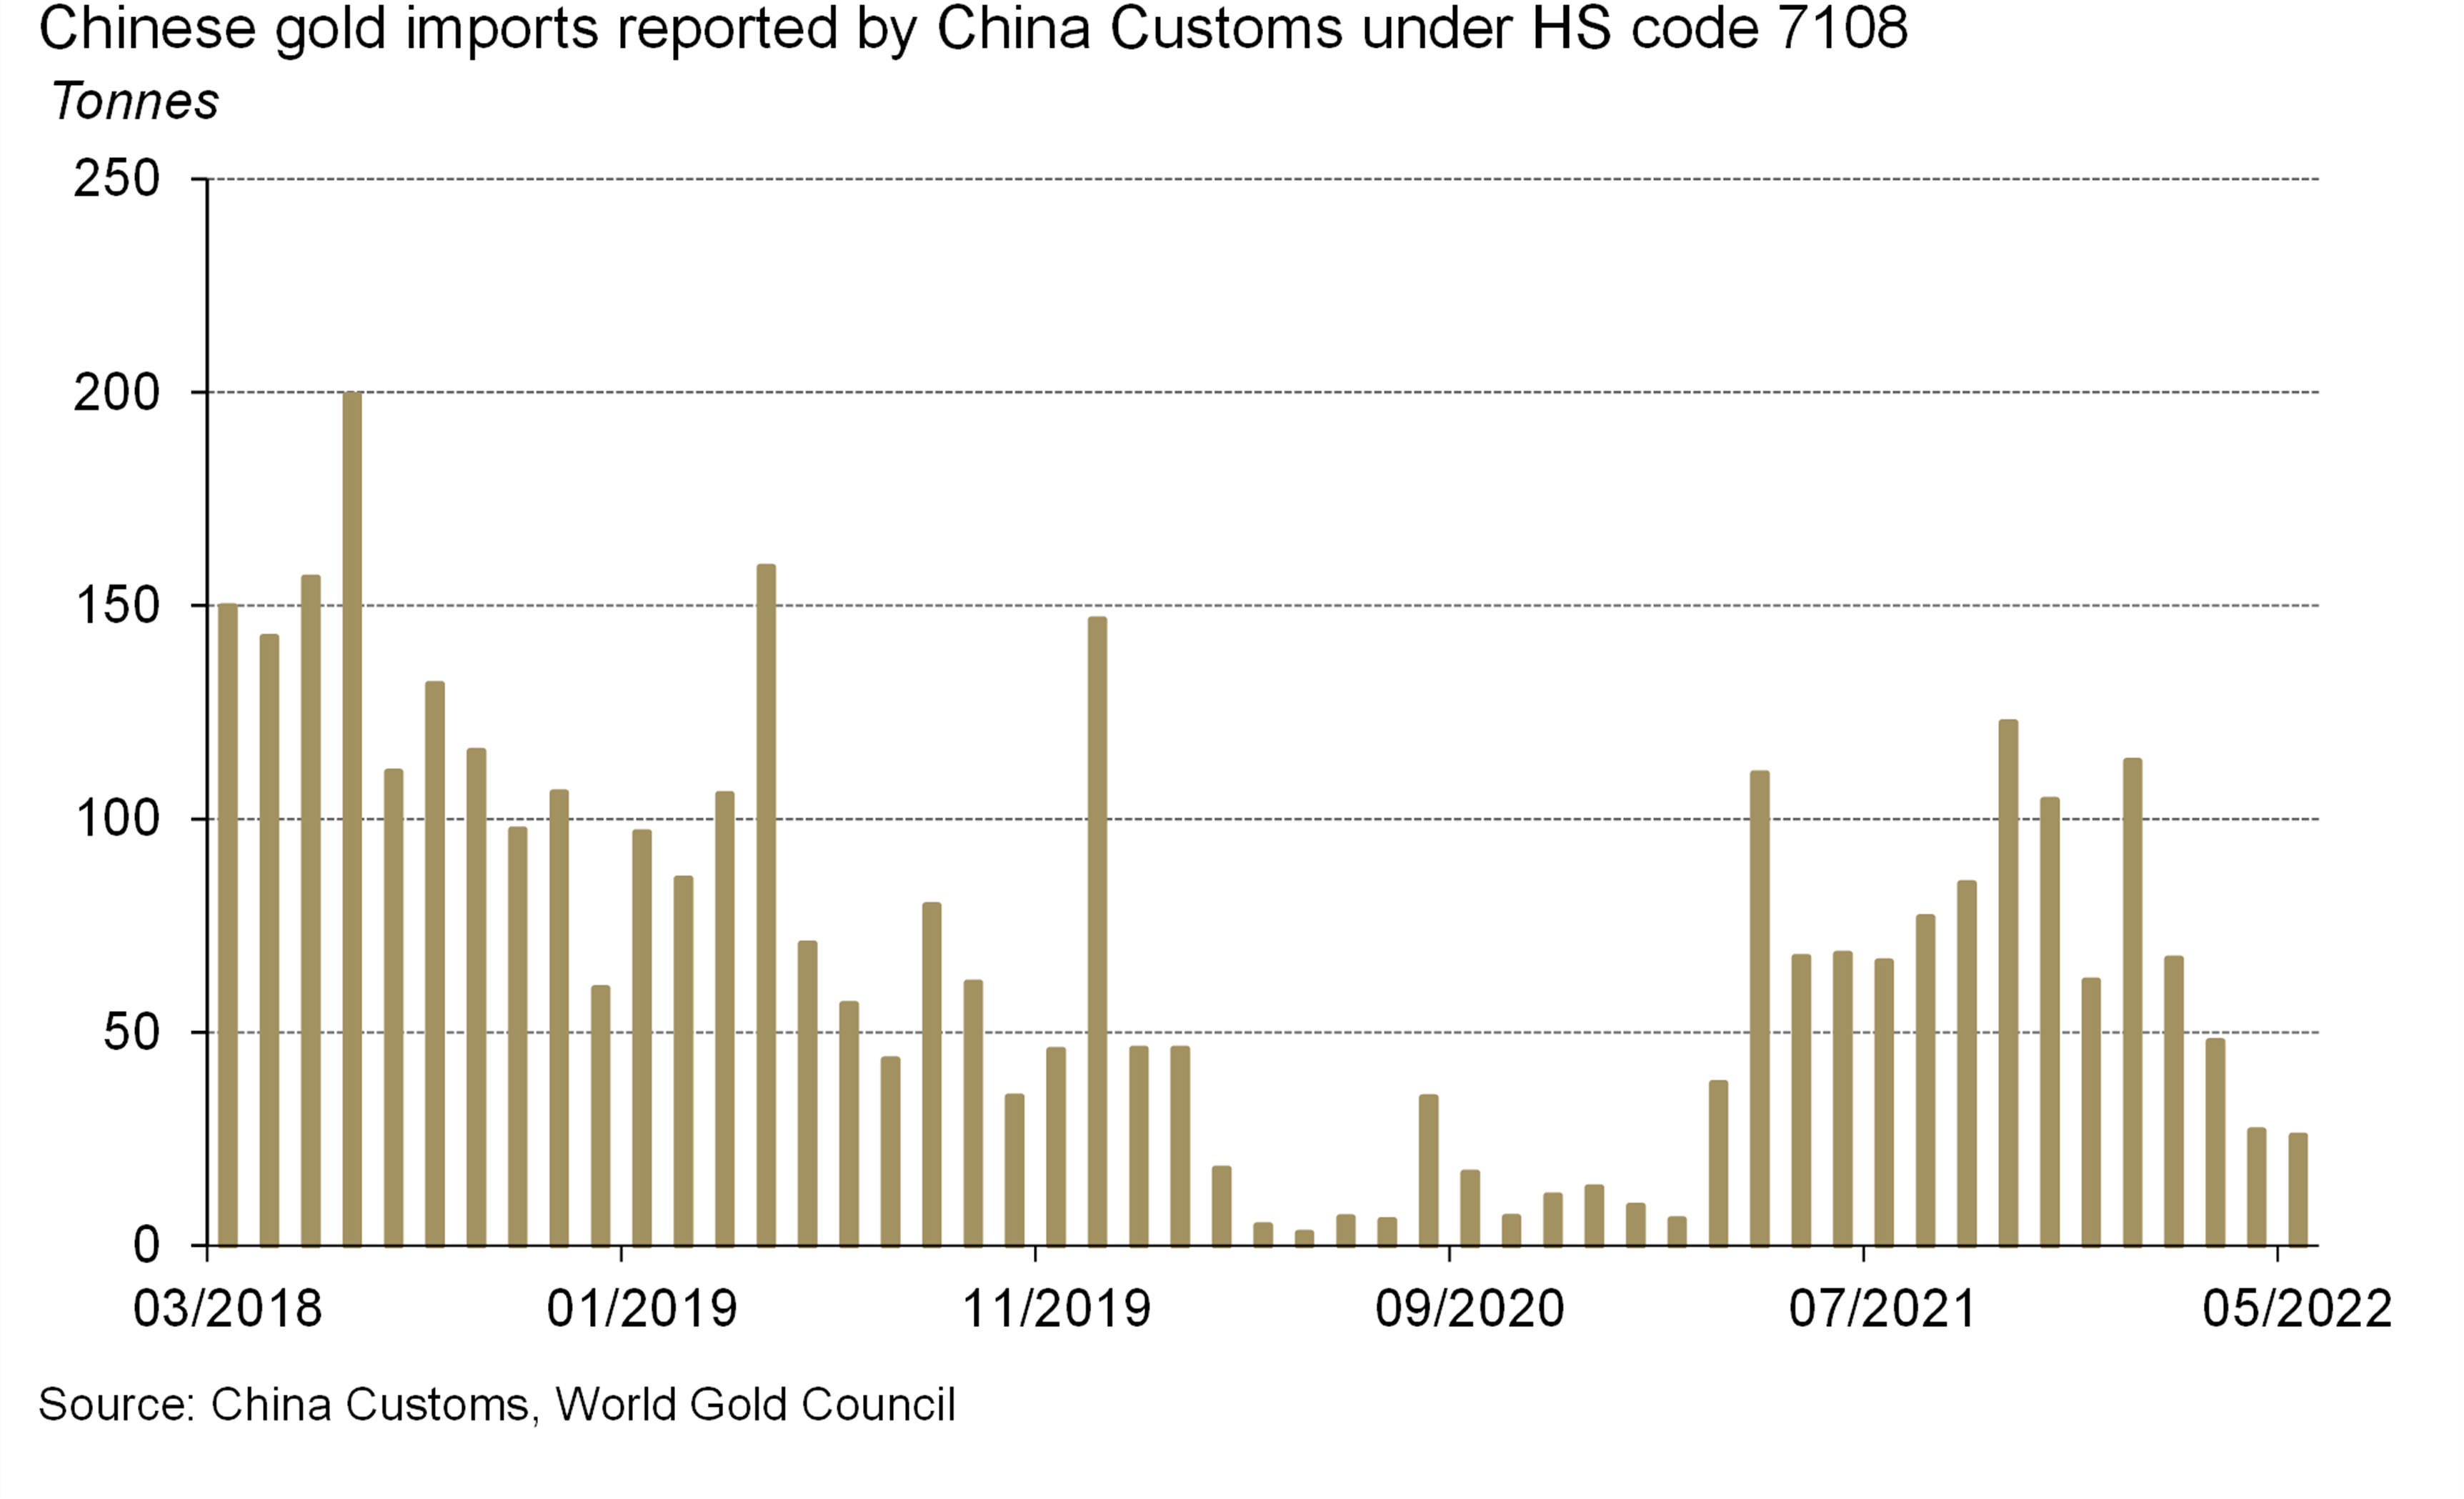
May’s gold imports stayed weak
26t of gold were imported by China in May, 1t lower m-o-m and significantly weaker y-o-y. Ongoing lockdowns and a narrow local gold price spread in May have been key drivers behind such weakness. 3
Gold Imports into china remained weak in May
Looking ahead
The COVID resurgence and lockdowns in major Chinese cities came as a bolt from the blue to China’s gold consumption in Q2. Only now has the industry begun to emerge from this restrictive and uncertain period While the pandemic’s aftermath may haunt local consumption for some time, as it did in 2020, we see a ray of hope in China’s gold demand recovery.
A potential economic slowdown may spell bad news for China’s gold jewellery consumption. But pent-up wedding demand, various stimuli rolled out by the government and structural changes in the industry, such as the continued migration towards a per-gram pricing method, should provide support in the second half. Meanwhile, rising local inflationary pressure, a weak RMB and economic uncertainties might bode well for gold investment demand in China.
For a more detailed H1 summary and H2 outlook, stay tuned for our upcoming Gold Demand Trends report at the end of this month.