Today, we released our annual 2019 gold-backed ETF flows summary, which highlights the significant investment demand for gold in 2019, along with an updated and improved Goldhub ETF flows section.
Global highlights include:
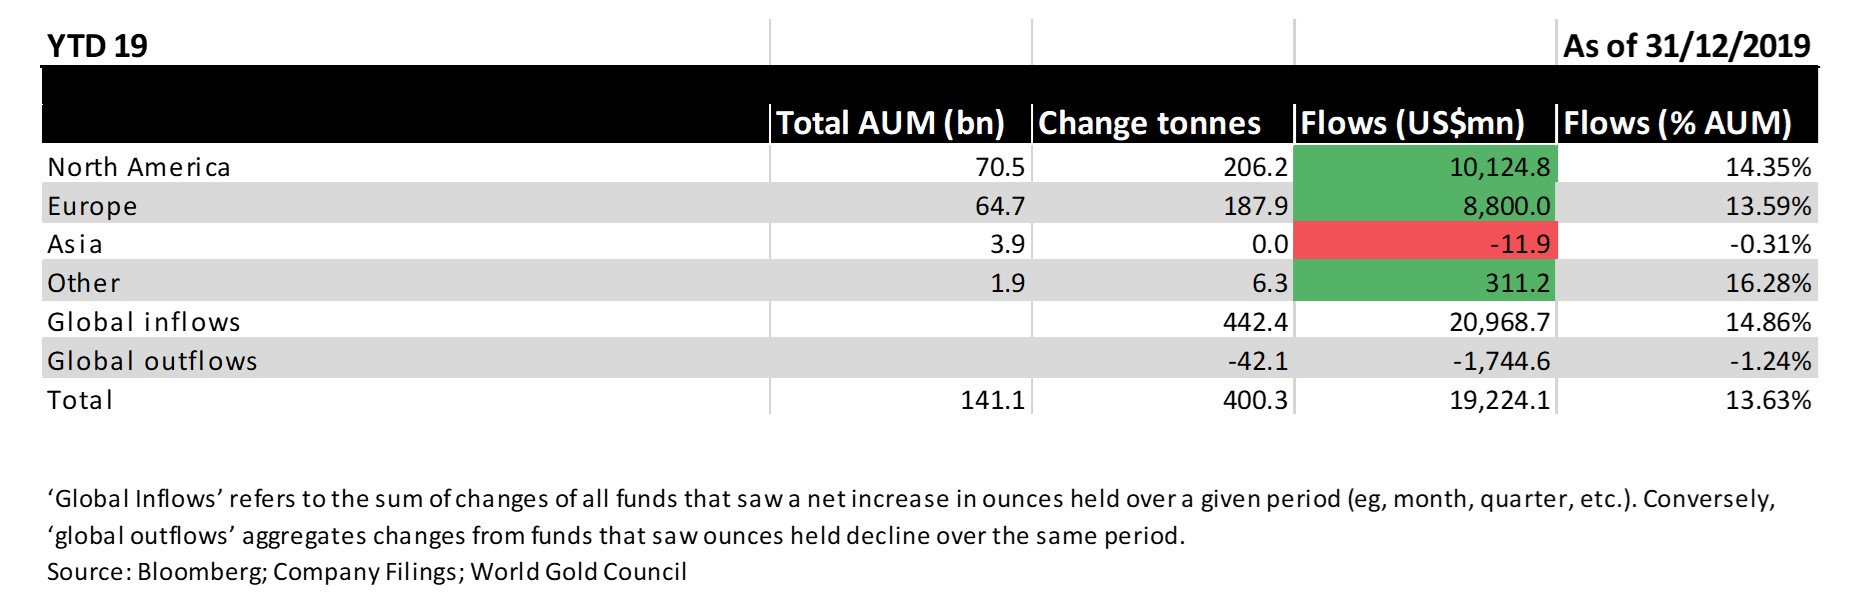
- US$19.2bn, or 400 tonnes(t), of net inflows in 2019 in almost all countries
- Collective ETF holdings reached all-time highs of ~2,900t in the fourth quarter.
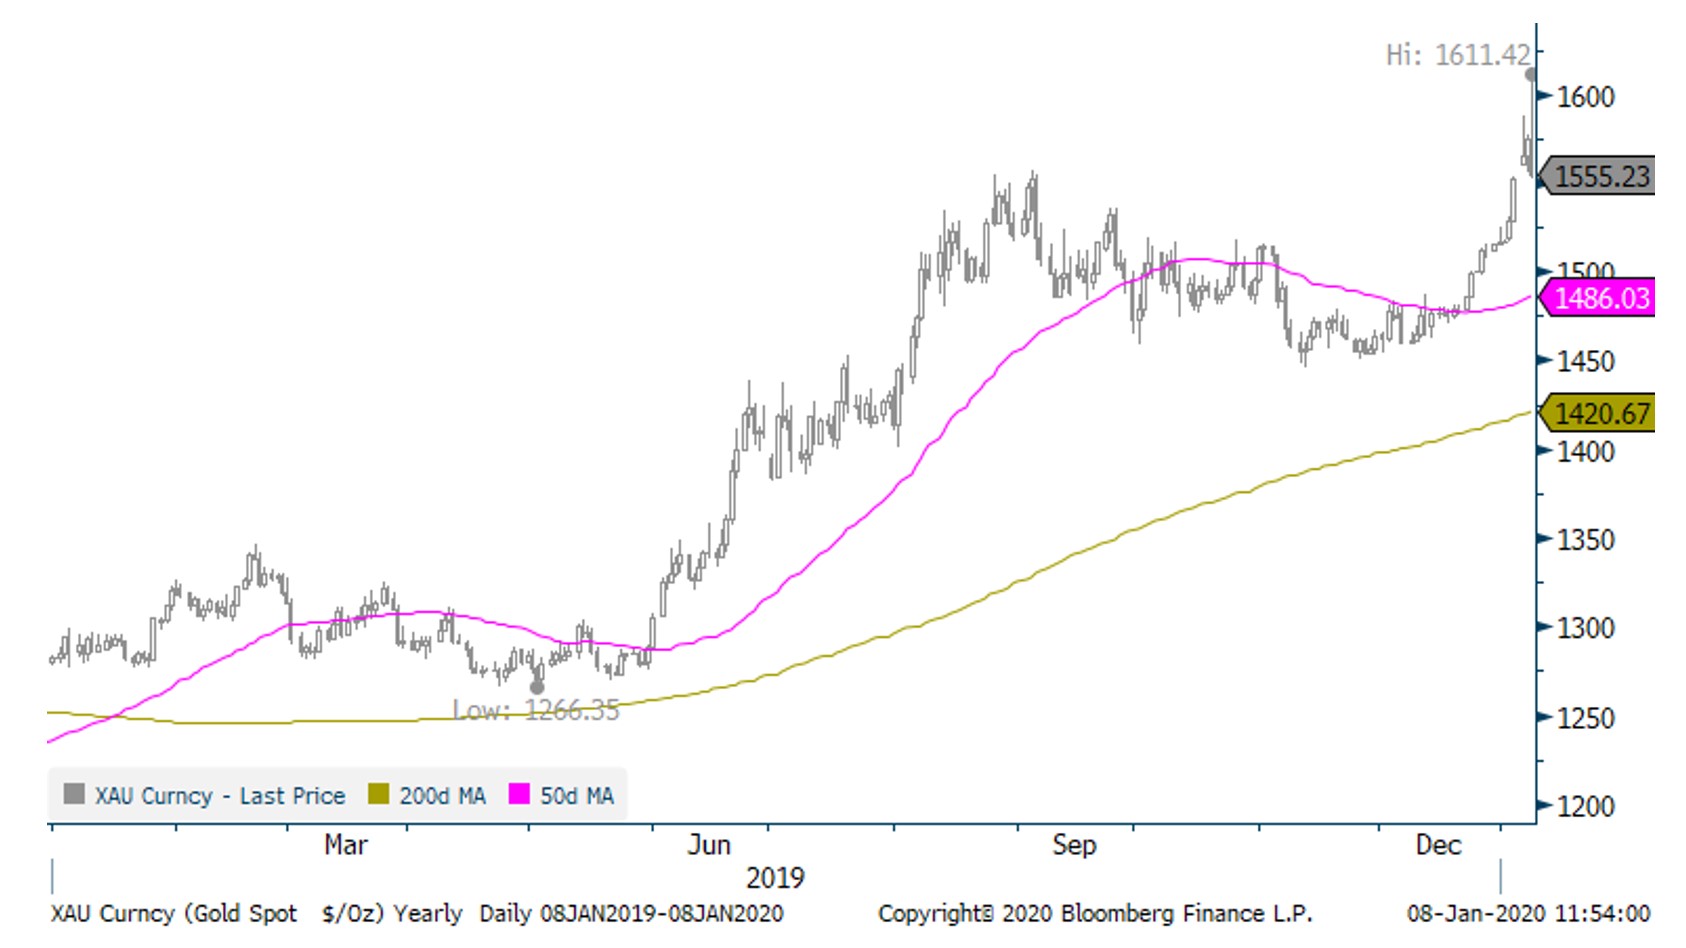
- AUM grew 37% in US dollars as the price increased 18.4%.
Source: Bloomberg
- The majority of inflows were into North American and European funds driven by
- geopolitical tensions
- The first Federal Reserve rate cuts in a decade
- Ongoing Brexit concerns.
- Our research indicates that:
- A shift from a hawkish or neutral stance to a dovish one has historically led gold to outperform – The impact of monetary policy on gold, and
- Lower rates tend to help gold prices and creates the potential for additional gold exposure (potentially replacing bonds).
Key trends that could support gold demand:
- Fed intervention in the repo market which some view as a form of quantitative easing
- Lack of a formally signed US/China trade deal
- Impact of the 2020 Brexit has yet to be realised
- Concerns around multiple expansion in the global stock markets, as well as surprisingly low yields in speculative corporate debt
- New tensions between the US and Iran
Goldhub gold-backed ETF flows section improvements
While the World Gold Council has been at the forefront of providing the best proprietary data and analysis for the gold-backed ETF market for some time, analyzing over 80 funds across 17 countries, we looked to build an even better experience.
Some of the new additions to the Goldhub ETFs section include:
- Additional charts and tables providing the ability to adjust and ‘slice’ dates and data
- Access to historical monthly reports and data, which previously included current reports
- Additional flows data back to 2003, to match the holdings data that already went back to 2003
- A formalized pdf template of monthly analysis
- Finally, flows (previously updated monthly) will now be updated on a weekly basis