What happened and some potential catalysts:
- On Thursday, gold traded higher by more than 2%, closing above $1,390, the highest level since 2013 and the largest single day move since late 2018, and is continuing its push higher early this morning.
- Gold is up more than 6% (in US dollars) in June, the strongest one-month rally in two years
- The move is a byproduct of persistent levels of uncertainty, lower rates and momentum
- The Fed’s dovish statement on Wednesday all but confirmed market expectations that they will cut rates at least once and, according to market expectations, up to three times by the end of the year
- The 10-yr yield briefly traded below 2% on Thursday – a level not seen since 2016 – while the US dollar continued to weaken
- As we’ve noted in our recent research and commentary, gold tends to perform well when the Fed shifts to a neutral or dovish stance
- Other positive potential catalysts include growing geopolitical concerns between the US and Iran, trade tensions, Brexit concerns and other macro risks.
Technicals:
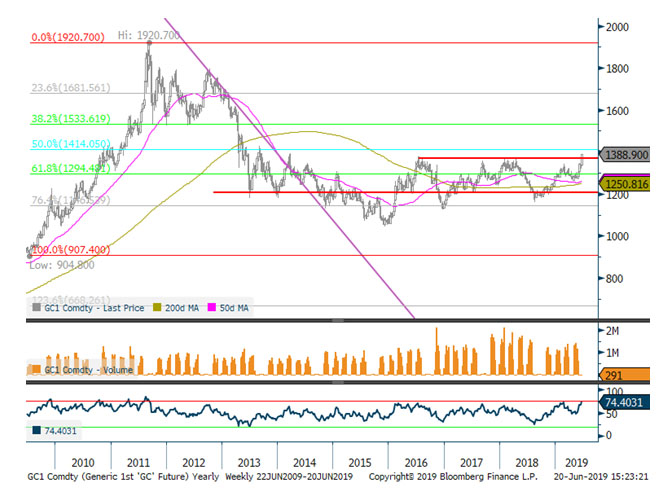
- $1,365 was a multiyear resistance level many traders viewed as an important barrier to substantiate a bullish call on the price of gold
- The sharp move through that level on heavy volume is very positive, suggesting the supply of sellers has subsided and there is potential upside
Gold futures price (weekly chart)
Source: Bloomberg
- We noted on Monday (6/17) the bullish positioning in the gold futures market as COMEX net longs continued to increase; similarly, investors are paying a premium for gold call options, while put options are inexpensive as investors are not focused on downside exposure.
- There have been justifiable reasons for the rally, but the price of gold has moved significantly higher in a very short period of time, and $1,400 could act as a psychological and technical resistance level.
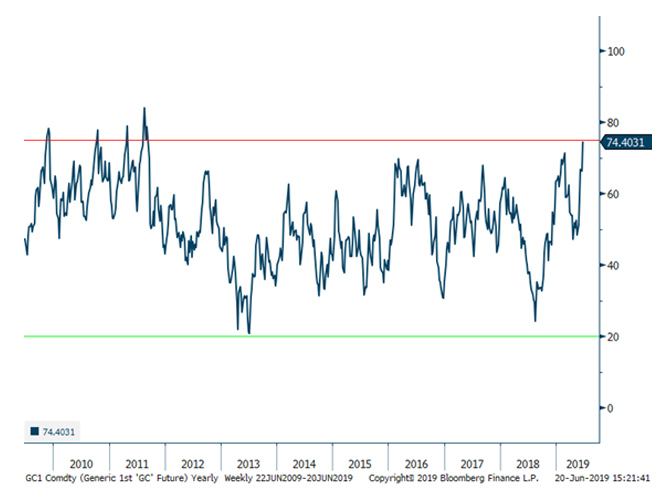
- In addition, the relative strength (RSI) of the gold price on a weekly basis it is at the highest level since 2011 which preceded a sell-off.
Gold weekly relative strength index (RSI)
Source: Bloomberg
- However, gold’s RSI reached similar levels in multiple occasions prior to that in 2010 and 2011, prior to large rallies.
- While there is evidence of both pullbacks and continued strength following these significant rallies in the past, it may take a few days to determine if the recent trend can continue
- If the price were to fall back to the $1,365 level and hold, it could stimulate heightened confidence in the potential for continued price momentum.
Things to watch today (6/21):
- The CFTC’s Commitment of Traders report is released today at 3pm and will show COMEX net longs as of Tuesday (6/18) – which is a barometer of momentum positioning. A continued upward trend could be a sign that investors are becoming increasingly optimistic about the direction of the gold price
- Today is also a quadruple-witching day in the markets (a day of expirations across multiple types of securities) that can lead to broad market volatility and could impact the price of gold
The above commentary is not investment advice and should be considered informational only.


