The traditional Defined Contribution (DC) investment portfolio made up of equities and bonds has come under increasing pressure in the last 18 months. Faced with rising inflation volatility risks and a highly uncertain economic backdrop, could now be the time to reconsider traditional thinking? We believe investors would benefit from expanding their “safe havens” options by considering gold.
Shortcomings of government bonds as a diversifier
For many DC investors, high quality government bonds, such as UK Gilts, have long fulfilled the traditional role of a diversifier in investment portfolios, offering protection during periods when risk assets have come under pressure. But the recent inflationary flare-up showed the limitations of such an approach. In fact, with major central banks turning decidedly more hawkish in 2022 as inflation proved far more persistent than predicted, traditional balanced portfolios suffered their largest losses in decades.
At present, the correlation between bonds and equities is positive, undermining fixed income’s value proposition as a portfolio diversifier. This has resulted in UK Gilts contributing a much larger share of total portfolio risk, i.e. nearly half of a balanced portfolio risk (Chart 1).
Chart 1: Contribution to portfolio risk
Portfolio allocation: 60% global equities, 40% UK Gilts*
Contribution to portfolio risk
Contribution to portfolio risk
Portfolio allocation: 60% global equities, 40% UK Gilts*
*Data from 31 August 2003 to 31 August 2023.
Source: Bloomberg, ICE Benchmark Administration, World Gold Council
Sources:
Bloomberg,
ICE Benchmark Administration,
World Gold Council; Disclaimer
*Data from 31 August 2003 to 31 August 2023.
Looking ahead, the upside to rates will likely be limited after the sharp rise in bond yields since early 2022. This has improved the return potential in many fixed income sectors but risks invariably exist. Persistent inflationary pressures remain the primary obstacle to monetary easing. This is what we witnessed over the last 21 months with a consistent upward recalibration of the terminal Bank of England policy rate (Chart 2). And a higher terminal rate from here (and its negative impact on fixed income assets) should not be ruled out.
Chart 2: Bank of England implied policy rate
The terminal rate has been repeatedly repriced up*
Bank of England implied policy rate
Bank of England implied policy rate
The terminal rate has been repeatedly repriced up*
*As of 31 August 2023.
Source: Bloomberg, World Gold Council
Sources:
Bloomberg,
World Gold Council; Disclaimer
*As of 31 August 2023.
Inflation volatility may also be part of the medium-term inflation story. In fact, looking at the US experience where we have data going back to 1870, in periods when inflation has exceeded 7%, it has tended to see echo waves two and five years after the initial spike (Chart 3).
Chart 3: Inflation cycle in the US since the 1870s
US inflation experienced, on average, multiple bounces after the first spike above 7%*
Inflation cycle in the US since the 1870s
Inflation cycle in the US since the 1870s
US inflation experienced, on average, multiple bounces after the first spike above 7%*
*Data from January 1871 to December 2022 which includes 10 cycles where inflation exceeded 7%.
Source: Robert Shiller CAPE ratio data, World Gold Council
Sources:
Robert Shiller CAPE ratio data,
World Gold Council; Disclaimer
*Data from January 1871 to December 2022 which includes 10 cycles where inflation exceeded 7%.
Moreover, the combination of high wage growth, the green transition, deglobalisation and geopolitical uncertainties speaks to an environment of more frequent potential shocks to inflation. Recent inflation developments in the UK are certainly going in this direction. Total wage growth reached a staggering 8.5% in July (Chart 4).
Chart 4: Record wage growth will worry the Bank of England
Total wage growth reached a staggering 8.5% in July*
Record wage growth will worry the Bank of England
Record wage growth will worry the Bank of England
Total wage growth reached a staggering 8.5% in July*
*As of 31 August 2023.
Source: Bloomberg, Office For National Statistics, World Gold Council
Sources:
Bloomberg,
Office for National Statistics,
World Gold Council; Disclaimer
*As of 31 August 2023.
Even stripping bonuses out, it reached an uncomfortable 7.8%. These growth rates do not suggest a return of inflation towards the target anytime soon, particularly with the ongoing rise in oil prices.
Indeed, short-term oil price fluctuations have a significant impact on long-term inflation expectations and inflation surprises (Chart 5).
Chart 5: The Bank of England may face additional challenges with the recent increase in oil prices*
The Bank of England may face additional challenges with the recent increase in oil prices*
The Bank of England may face additional challenges with the recent increase in oil prices*
*Data from 31 December 2017 to 15 September 2023.
Source: Bloomberg, World Gold Council
Sources:
Bloomberg,
World Gold Council; Disclaimer
*Data from 31 December 2017 to 21 August 2023
And if a new inflation shock were to take hold, such an environment would require ongoing and fairly dramatic adjustments to monetary policy from the Bank of England, introducing volatility, potentially below-trend growth, and the possibility of negative returns in sterling fixed income allocations.
As Chart 6 shows, higher inflation weakens the appeal of government bonds as a diversifier. At inflation levels below 2%, the correlation between global equities and global treasuries has been negative, providing diversification. At levels above 2%, this relationship has historically started to break down.
Chart 6: Bond-equity correlations shift as inflation rises
Rolling 3yr correlation of global equity and global treasury bond returns vs. 3yr average G7 core inflation*
Bond-equity correlations shift as inflation rises
Bond-equity correlations shift as inflation rises
Rolling 3yr correlation of global equity and global treasury bond returns vs. 3yr average G7 core inflation*
*As of 31 August 2023.
Source: Bloomberg, OECD, ICE Benchmark Administration, World Gold Council
the contribution to portfolio risk from bonds is now much greater
there is no guarantee that bond and equity correlations will turn negative again and remain stable, particularly considering the potential for inflation volatility.
It is important, therefore, to have assets that can help in these scenarios and not rely solely on government bonds as your diversifier.
Gold in DC investment portfolios
We have thus far outlined the challenges facing DC investors trying to design well-balanced portfolios. They need to be cautious of the risks of inflation and take account of the larger contribution to risk from bonds.
Our analysis shows gold is a clear complement to equities, bonds and broad-based portfolios. A store of wealth and a hedge against systemic risk, currency depreciation and inflation, gold has historically improved portfolios’ risk-adjusted returns, delivered positive returns, and provided liquidity to meet liabilities in times of market stress.
While effective diversifiers are sometimes hard to find, with many assets becoming increasingly correlated as market uncertainty rises, gold is different in that its negative correlation to equities and other risk assets, as seen in Chart 7, increases as these assets sell off.
Chart 7: Gold’s diversification benefits improve at times of market stress
Correlation of global equities vs. gold and UK Gilts in various environments*
Gold’s diversification benefits improve at times of market stress
Gold’s diversification benefits improve at times of market stress
Correlation of global equities vs. gold and UK Gilts in various environments*
Based on weekly returns of the FTSE Global Developed Index, LBMA Gold Price and ICE BofA UK Gilt Index using data between 31 December 1993 and 31 December 2022.
Source: Bloomberg, ICE Benchmark Administration, World Gold Council
Sources:
Bloomberg,
ICE Benchmark Administration,
World Gold Council; Disclaimer
*Based on weekly returns of the FTSE Global Developed Index, LBMA Gold Price and ICE BofA UK Gilt Index using data between 31 December 1993 and 31 December 2022.
With few exceptions, gold has been particularly effective during times of systemic risk, generating positive returns in 8 of the 10 worst quarters of performance for the MSCI World index (Chart 8). Of the remaining two quarters, gold outperformed the MSCI World index in both cases reducing overall portfolio losses.
Chart 8: Gold provides downside protection
Global equities, UK Gilts and gold returns (in GBP) during periods of systemic risk*
Gold provides downside protection
Gold provides downside protection
Global equities, UK Gilts and gold returns (in GBP) during periods of systemic risk*
*Data from 31 December 1999 to 31 August 2023.
Source: Bloomberg, ICE Benchmark Administration, World Gold Council
Sources:
Bloomberg,
ICE Benchmark Administration,
World Gold Council; Disclaimer
*Data from 31 December 1999 to 31 August 2023.
With inflation remaining at multi-decade highs, DC scheme members may be most concerned about increases to their cost of living, which are likely to outpace salary growth. Members in the early part of their savings journey will likely continue to focus on growth assets, but those closer to retirement may need guidance about what higher inflation means for their retirement plans and how their investment strategy can protect the real value of their savings.
Gold has long been considered a hedge against inflation – and the data confirms this (Chart 9). What’s more, gold’s annualised return of 8.3% in GBP over the past 50 years has outpaced both the UK and world consumer price indices (CPI).
Chart 9: Gold historically performs well in periods of high inflation*
Gold historically performs well in periods of high inflation*
Gold historically performs well in periods of high inflation*
*Inflation computed using annual UK CPI year-on-year changes between December 1971 and December 2022.
** For each year in the sample, real return = (1+nominal return)/(1+inflation)-1.
Source: Bloomberg, ICE Benchmark Administration, World Gold Council
Sources:
Bloomberg,
ICE Benchmark Administration,
World Gold Council; Disclaimer
*Inflation computed using annual UK CPI year-on-year changes between December 1971 and December 2022.
** For each year in the sample, real return = (1+nominal return)/(1+inflation)-1.
Case Study – The impact of gold in DC investment portfolios
From current levels, a traditional equity/bond portfolio may not deliver the type of diversification and returns achieved historically. As a result, we believe DC investors should consider alternative and complementary assets to high quality government bonds, such as gold.
What is appropriate at different stages of DC investing and where could gold fit?
A core belief of the DC pension industry is that risk will be rewarded over long horizons, while effective risk management is needed to support good outcomes for those closer to retirement (Chart 10). As such, in the accumulation phase, members are a long way from retirement and have time to ride out the ups and downs of the stock market. In this phase, and despite the fact that gold has delivered some healthy returns over the last 50 years, short-term risk mitigation through diversification of asset classes, and the addition of gold, could be seen as a headwind to potentially higher long-term returns. We are, however, of the opinion that gold has a role to play in the consolidation and retirement phases, when protecting against market downturns is particularly important, given the relatively little time left to recover negative returns.
Chart 10: Gold has a key role to play in the consolidation and retirement phases
Hypothetical retirement journey
Gold has a key role to play in the consolidation and retirement phases
Gold has a key role to play in the consolidation and retirement phases
With member outcomes being a key factor in setting all aspects of DC strategy, we assess how an allocation to gold can impact the future retirement incomes of investors.
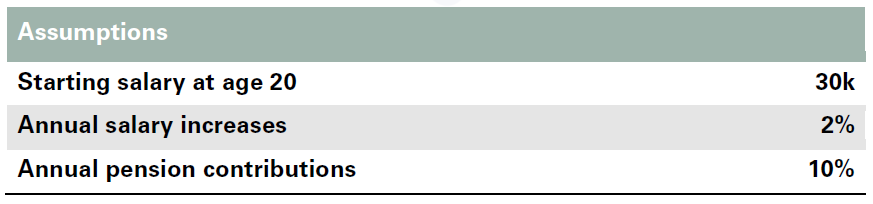
Using long-term asset class forecasts (see Appendix for more details) and assumptions around starting salary, salary increases and contributions (Table 1), we’ve projected the range of potential pension outcomes for a glidepath with and without gold (Chart 12 and Chart 13, see Appendix for details). The glidepath with gold has a modest but meaningful 5% allocation to gold built over the consolidation phase of the retirement journey.
Table 1: Monte Carlo assumptions
Source: World Gold Council
These forward-looking projections provide us with a number of key insights (Chart 11):
the distribution of outcomes at retirement (age 65) for a glidepath with gold is skewed towards the right-hand side, meaning the median portfolio at retirement is higher and the potential worst outcomes are reduced
a 5% gold allocation throughout retirement can also provide a more secure income in retirement, as a portfolio following a glidepath with gold will exhaust its assets later than a portfolio without gold.
Chart 11: Glidepaths with gold consistently outperformed glidepaths without gold
Difference in balance at retirement between a glidepath with gold and without gold*
Glidepaths with gold consistently outperformed glidepaths without gold
Glidepaths with gold consistently outperformed glidepaths without gold
Difference in balance at retirement between a glidepath with gold and without gold*
*As of 31 August 2023.
Note: Monte Carlo simulation results for 5,000 portfolios using long-term asset class forecasts from Blackrock and WGC and historical asset correlations and volatility based on monthly returns between 31 December 1999 and 31 August 2023. The distribution of outcomes suggests portfolios with gold outperform.
Source: Portfolio Visualizer, World Gold Council
Sources:
Portfolio Visualizer,
World Gold Council; Disclaimer
*As of 31 August 2023.
Note: Monte Carlo simulation results for 5,000 portfolios using long-term asset class forecasts from Blackrock and WGC and historical asset correlations and volatility based on monthly returns between 31 December 1999 and 31 August 2023. The distribution of outcomes suggests portfolios with gold outperform.
Conclusion
In short, there are several advantages to diversifying the sources of safety in an investment portfolio beyond just high-quality government bonds. The way gold and government bonds perform going forward is likely to be different from one another. That feature alone should appeal to DC investors.
As demonstrated in the case study, gold can help mitigate the key risks faced by DC investors – investment risk, inflation risk and longevity risk – by providing diversification that works, protection against high and extreme inflation, and enhancing risk-adjusted returns.
Appendix
Asset class forecasts:
Gold: the World Gold Council has developed a framework to better understand gold valuation. Our Gold Valuation Framework powers our web-based tool, Qaurum, which allows users to assess the potential performance of gold under customisable hypothetical macroeconomic scenarios provided by Oxford Economics.
Equities & bonds: we have used Blackrock’s long-term asset class forecasts. These forecasts are forward-looking estimates of total return, generated through a combined assessment of current valuation measures, economic growth, inflation prospects, yield conditions, as well as historical price patterns.
Chart 12: Target Date Fund – hypothetical glidepath example without gold*
Target Date Fund – hypothetical glidepath example without gold*
Target Date Fund – hypothetical glidepath example without gold*
All references to LBMA Gold Price are used with the permission of ICE Benchmark Administration Limited and have been provided for informational purposes only. ICE Benchmark Administration Limited accepts no liability or responsibility for the accuracy of the prices or the underlying product to which the prices may be referenced. Other content is the intellectual property of the respective third party and all rights are reserved to them.
The use of the statistics in this information is permitted for the purposes of review and commentary (including media commentary) in line with fair industry practice, subject to the following two pre-conditions: (i) only limited extracts of data or analysis be used; and (ii) any and all use of these statistics is accompanied by a citation to World Gold Council and, where appropriate, to Metals Focus or other identified copyright owners as their source. World Gold Council is affiliated with Metals Focus.
WGC does not guarantee the accuracy or completeness of any information nor accepts responsibility for any losses or damages arising directly or indirectly from the use of this information. This information is for educational purposes only and by receiving this information, you agree with its intended purpose.
Nothing contained herein is intended to constitute a recommendation, investment advice, or offer for the purchase or sale of gold, any gold-related products or services or any other products, services, securities or financial instruments (collectively, “Services”). This information does not take into account any investment objectives, financial situation or particular needs of any particular person.
Diversification does not guarantee any investment returns and does not eliminate the risk of loss. Past performance is not necessarily indicative of future results. The resulting performance of various investment outcomes that can be generated through allocation to gold are hypothetical in nature, may not reflect actual investment results and are not guarantees of future results. WGC does not guarantee or warranty any calculations and models used in any hypothetical portfolios or any outcomes resulting from any such use. Investors should discuss their individual circumstances with their appropriate investment professionals before making any decision regarding any Services or investments.
This information may contain forward-looking statements, such as statements which use the words “believes”, “expects”, “may”, or “suggests”, or similar terminology, which are based on current expectations and are subject to change. Forward-looking statements involve a number of risks and uncertainties. There can be no assurance that any forward-looking statements will be achieved. WGC assumes no responsibility for updating any forward-looking statements.
Information regarding QaurumSM and the Gold Valuation Framework
Note that the resulting performance of various investment outcomes that can generated through use of Qaurum, the Gold Valuation Framework and other information are hypothetical in nature, may not reflect actual investment results and are not guarantees of future results. Neither WGC nor Oxford Economics provides no warranty or guarantee regarding the functionality of the tool, including without limitation any projections, estimates or calculations.