The benefits of certain portfolio hedges came into clear focus during the 2008-2009 financial crisis and did so again during the subsequent European sovereign debt crisis, the 2018 December stock market pullback and the most recent COVID-19 pandemic.
Many tail hedges work well during crises if timed appropriately, but are technically complex investments, and can be expensive to hold systematically.
Historically, gold prices have not increased as rapidly in tail events1 as hedges that track market volatility indices.2But, importantly, gold has served as a safe haven, improving risk-adjusted returns and adding welcome liquidity during times of crisis, without the costly effects of systematic implementation or the difficulties of market timing.3
Comparing hedges across metrics
We have established the Relevance of gold as a strategic asset and the importance of portfolio diversification, but in this analysis we look specifically at gold’s role as a hedge compared to other well-established hedges.4
We focus on volatility and credit hedges as well as real assets, particularly precious metals, and adjust the amount of a given hedge in a portfolio depending on the risk exposure of that portfolio.5 Finally, we ranked the effectiveness of each hedging strategy based on attributes including returns, portfolio volatility, risk-adjusted returns and portfolio drawdown.
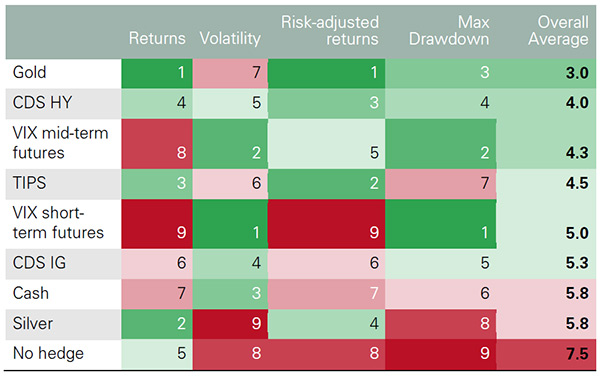
Our analysis shows that, historically, any of the hedging choices are better than a diversified hypothetical portfolio without hedging (Table 1). And while each of the choices have merit in various market conditions, our analysis shows that historically, gold is generally the overall optimal hedge over the long run when considering these attributes.
Table 1: Performance of hedging strategies in an average pension fund portfolio over the past 20 years*
Ranked (1= most optimal to 9 = least optimal) for each category and overall.
*Performance between March 2000 and March 2020. The hypothetical portfolio is based on Willis Towers Watson Global Pension Assets Study 2019 and Global Alternatives Survey 2017 as described in the Appendix in the full report.5 Performance is based on blended weights of the hedges ranging from 2.5% to 10% of the portfolio, proportionately reducing the rest of the portfolio by the initial weights. ‘Returns’: average of cumulative and average returns; ‘Volatility’: overall portfolio volatility; ‘Risk-adjusted returns’: average of the return on risk, Sharpe ratio and information ratio; ‘Max drawdown’: the most the portfolio lost during any trough. See the Appendix in the full report and footnote4 for definitions of ‘VIX short-term futures’ ‘CDS IG’, ‘CDS HY’; and ‘TIPS’.
Source: Bloomberg, World Gold Council
Hedging tail events is often a compromise between the greatest protection and cost
We often highlight gold’s role as a safe haven, most recently in our Investment Update: Gold prices swing as markets sell off, which shows that gold can provide liquidity and protection in risk-off scenarios, especially during so-called systemic events that affect multiple regions and industries (Chart 1). When stock markets sell off quickly, correlation across risk-assets can increase and portfolios that were thought to be diversified could experience unexpected drawdowns, forcing margin calls and low funding ratios.
Chart 1: Gold tends to outperform in left-tail events1
Chart 1: Gold tends to outperform in left-tail events
Performance of gold, US Treasuries and S&P 500 during VIX spikes
Sources:
Bloomberg,
ICE Benchmark Administration,
World Gold Council; Disclaimer
*See the Appendix in the full report and footnote1 for the tail-event dates. ‘rhs’ stands for right-hand-side.
Investors often rely on selling highly liquid assets like gold in these events, which can sometimes lead to temporary liquidations, as seen in the recent COVID-19 selloff. While correlation for most major asset classes, including gold, increased meaningfully during the most recent stock market selloff, gold’s correlation to the stock market remained flat to slightly negative (Chart 2).
Chart 2: Correlation increased across all major asset classes except three-month Treasuries during the COVID-19 selloff
Chart 2: Correlation increased across all major asset classes except 3-month Treasuries during the COVID-19 selloff
One-year daily correlation of some widely followed major assets and the S&P 500 versus the daily correlation during the selloff.
Sources:
Bloomberg,
World Gold Council; Disclaimer
The pale bar represents the daily correlation from 23 March 2019 to 23 March 2020, while the darker bar represents the daily correlation from 19 February 2020 through 23 March 2020, the peak to trough dates of the S&P 500 prices. The bars represent the actual levels; so for example, the one-year correlation in gold was -0.34, while the most recent correlation was -0.046 3m Treasuries exhibited minimal correlation during the past year, which is why the pale bar appears non-existent.
But, as systemic events unfold, gold tends to outperform. In general, the stronger the pullback in the stock market, the more negatively correlated gold becomes with the market highlighting its effectiveness in a sustained pullback (Chart 3).
Chart 3: Gold and stock market correlation becomes more negative with more pronounced market moves
Chart 3: Gold and stock market correlation becomes more negative as the moves become more pronounced
S&P 500 and gold weekly correlation in tail events*
Sources:
Bloomberg,
World Gold Council; Disclaimer
*Correlations computed using weekly returns based on the Bloomberg Barclays US Treasury Index and the LBMA Gold Price PM since January 1971
Analysing tail events is important, but the events are not always contained within a neat periodic window. They can occur at much shorter intervals and barely register in weekly returns, as we saw during the infamous ‘flash crash’ of 2010 when markets fell precipitously, only to recover quickly. They could drag out like 2008 and span several months with non-contiguous but frequent selloffs. In fact, an effective tail-risk hedge may need to extend its performance beyond the window that defined the event.
Volatility-related hedges like VIX futures and other index put option strategies have been shown to mean revert. In other words, if the selloff is an isolated event, then the value of the hedge is likely to come tumbling back towards the average quickly afterwards. Owning put options, in particular, is a form of insurance that requires ‘buying’ protection. Because there are various forms of listed option structures outside of VIX futures, we focus on the VIX as a barometer for option performance. Much like the VIX, option insurance can erode overall portfolio performance meaningfully if implemented systematically.
This is why we consider overall portfolio performance, risk-adjusted returns and the portfolio drawdowns to assess the best overall hedges (Table 1 and Table 3). Each metric highlights different qualities of a hedge; namely overall portfolio performance, portfolio volatility, how that volatility impacts performance, and how well the hedge helps with pullbacks or tail-events. We now address the behaviours of some of the various hedges in each category.
Volatility hedges are costly, but historically have provided protection if timed right
VIX can work well - if you time it!
While the VIX itself is not investible, owning VIX futures across most tenors, along with portfolio insurance via option strategies like put options has historically provided the clearest levered or explosive protection during a tail event. This was evidenced most recently in the COVID-19 pullback, as the VIX traded at or near record highs. Timing the event with VIX futures or options purchased would have paid out handsomely.
The problem with owning VIX futures specifically is that, when implemented systematically, they provide a negative expected value, seriously eroding portfolio performance over time and requiring resources that require position monitoring not present in passive hedging strategies. Owning VIX short-term futures, for instance, can erode performance by nearly 2% a year (Table 3). This portfolio attrition has been more significant during the past four years, linked to what is known as the “Trump bump”, with quantitative easing measures as well as low rates propelling stocks to their longest bull market in history (Chart 4). It is worth noting that all of the hedges in our analysis, except the short-term VIX futures, have historically improved risk-adjusted returns, when compared to a portfolio with no hedges over the past 20 years.
Interestingly though, while VIX futures risk-adjusted returns performed poorly, they significantly reduce portfolio volatility. VIX futures greatly reduce portfolio drawdown, but at a considerable cost.
Chart 4: Market volatility has been much lower since the financial crisis and Trump presidency*
Chart 4: Market volatility has been much lower since the financial crisis and Trump presidency*
Sources:
Bloomberg,
World Gold Council; Disclaimer
*Based on month-end prices from January 1989 to March 2020
Credit hedges have had the best tail-event performance since the financial crisis
Credit hedges
Liquid indices on credit default swaps (CDS), a type of insurance on credit events on corporate bonds, such as a stress or default, are popular with investors. They represent an easier way to express a bearish view on corporate bonds than actually shorting the bonds - though access for ordinary investors is limited, as they generally trade over-the-counter (OTC). While holdings of these structures over the long term can hurt cumulative returns because of the premium paid, many of the most recent tail-events were credit related. As such, these positions have positively contributed to portfolio performance since the financial crisis, performing better than any other hedge during these events (Table 2).
Table 2: Short credit trades via CDS have done particularly well since the financial crisis
Investment grade and high yield CDS have led performance in the past five tail-events including and following the financial crisis*
Hedge
Average
Max
Min
CDS IG
205.2%
375.7%
58.4%
CDS HY
130.0%
313.8%
9.0%
VIX short-term futures
111.6%
253.4%
11.8%
VIX mid-term futures
62.6%
120.2%
29.0%
Gold (US$/oz)
17.5%
47.5%
-3.2%
Cash
7.5%
15.9%
2.4%
Silver
5.4%
36.7%
-30.1%
TIPS
4.2%
13.1%
-0.5%
*Financial crises since 2008 as highlighted in Chart 1. Index explanations can be found in the Appendix in the full report footnote 4.
Source: Bloomberg, World Gold Council
Fixed income hedges can act like risk assets
Treasuries provide limited diversification
Investors often include US Treasuries as hedges to their stock allocation. But while there is generally an initial positive move in Treasuries as crises begin, contrary to popular belief, when looking at the last 20 and 30 years, the correlation of US Treasuries to the S&P 500 is generally somewhat positive in tail events; it is during the non-tail events that Treasuries provide diversification. (Chart 5 and Chart 6). During the COVID-19 drawdown in stocks, for example, longer-dated bonds had a daily correlation of 0.60 with the S&P 500.
Treasury Inflation-Protected Securities (TIPS) have done meaningfully well as a portfolio hedge, particularly as it relates to overall portfolio performance. Part of this is likely a diversification factor and the fact that bonds have enjoyed a multi-decade bull market. TIPS, however, are the poorest performers when it comes to tail events and rank near the bottom in portfolio drawdowns (Table 1). While they would likely help in an inflationary event, they have not been shown to effectively hedge systemic events.
Chart 5: In tail-risk events, Treasuries have not behaved according to conventional wisdom….
Chart 5: In tail events, Treasuries have not behaved according to conventional wisdom….
Gold has acted much better as a tail hedge over the past 20 and 30 years*
Sources:
Bloomberg,
World Gold Council; Disclaimer
*As of March 2020. See footnote 3 in Appendix in the full report for times series explanations.
Chart 6: …despite good diversification when considering all periods*
Chart 6: …despite good diversification when considering all periods*
Sources:
Bloomberg,
World Gold Council; Disclaimer
Weekly returns for the period March 1990 - March 2020, based on available data.8
Precious metals, like gold, provide a balanced effective hedge
The irony behind diversification is that many investors want it when markets go awry but prefer high correlation when markets do well. Most risk assets have provided diversification on the way up but become highly correlated on the way down. Furthermore, hedges that provide diversification on the way down can erode performance on the way up.
Gold is one of the few hedges that is positively correlated in risk-on environments, yet becomes increasingly negatively correlated in risk-off environments - and has been for nearly 50 years (Chart 7).
Chart 7: Gold works well in varying market conditions
Chart 7: Gold works well in varying market conditions
Sources:
Bloomberg,
World Gold Council; Disclaimer
January 1971 - March 2020. See footnote 3 in Appendix for times series explanations9
And unlike financial assets, gold is a real asset: it has no credit or counterparty risk and is supported by high inflation. This is why, in terms of cumulative and annual returns, real assets like gold and silver have performed best over the past 20 years.
Silver is often lumped into the gold investment story; its higher volatility than gold makes it compelling to some investors when precious metals, in general, are moving higher. As we discussed in Gold: the most effective commodity investment, silver tends to be much more correlated with the performance of the economy than gold, particularly to the downside. And while it boosts overall returns when used as a hedge, it also increases portfolio volatility to levels above that of an unhedged portfolio, significantly reducing risk-adjusted returns and thus eliminating some of the rationale for a hedge in the first place.
Gold ranks near the bottom in terms of reducing portfolio volatility, the only metric for which it does not land near the top. But, when factoring in its returns, it takes the top spot across various risk-adjusted metrics.
Summary
Gold stands out as a key portfolio component when identifying a long-term portfolio diversifier. Historically, gold has shown that it acts as an effective hedge and a useful part of the larger tail-risk picture.
Volatility-linked hedges like VIX futures and index options, are more effective than gold at reducing both portfolio drawdown and volatility, but the long-term returns of a portfolio that includes VIX futures have been almost halved.
While gold is not necessarily the best ‘volatility hedge’, an allocation to gold can not only improve both absolute and risk-adjusted returns when compared to an unhedged portfolio but can also provide the protection needed in times of market stress. And when one factors in the low cost of ownership, the protection afforded, the low level of active management required and the breadth of application, gold can clearly serve as a valuable alternative.
Table 3: Strategy performance
Blended performance of various hedges over the past 20 years*
Cumulative return
Annualised return
Volatility
Return on risk
Sharpe ratio
Information ratio
Max drawdown
Gold
200%
5.6%
9.9%
0.57
0.38
0.09
-39.0%
Silver
191%
5.5%
10.7%
0.51
0.33
0.08
-40.3%
TIPS
176%
5.2%
9.7%
0.54
0.34
0.07
-40.2%
CDS HY
174%
5.2%
9.6%
0.54
0.34
0.07
-39.6%
No hedge
173%
5.1%
10.5%
0.49
0.31
0.06
-43.2%
CDS IG
161%
4.9%
9.6%
0.51
0.32
0.05
-39.9%
Cash
161%
4.9%
9.6%
0.51
0.31
0.05
-40.0%
VIX mid-term futures
144%
4.6%
8.0%
0.57
0.33
0.04
-34.3%
VIX short-term futures
95%
3.3%
7.3%
0.45
0.19
-0.04
-30.5%
*Based on performance between March 2000 and March 2020. Performance is based on blended weights of the hedges ranging from 2.5% to 10% of the portfolio, proportionately reducing the rest of the portfolio by the initial weights. See footnote5 for portfolio weights. Sorted by overall cumulative portfolio performance
4The selection of hedges is by no means exhaustive, and omits more complex structures. It is illustrative of various thematic approaches. See Appendix in the full report for an explanation of the hedging strategies. While there may be other more complex structured products, often called exotic structures, they are highly individualised and not available to most investors.
5Based on our historical analysis, we have found that an allocation of 2.5% to 10% of gold to a typical pension fund is optimal and have used this amount for other hedging strategies. See Appendix in the full report for portfolio composition.
6See Appendix in the full report for the representative indices used in the correlation calculations.
7For information on ‘sigma events’ and calculations see Appendix in the full report.
All references to LBMA Gold Price are used with the permission of ICE Benchmark Administration Limited and have been provided for informational purposes only. ICE Benchmark Administration Limited accepts no liability or responsibility for the accuracy of the prices or the underlying product to which the prices may be referenced. Other content is the intellectual property of the respective third party and all rights are reserved to them.
WGC does not guarantee the accuracy or completeness of any information nor accepts responsibility for any losses or damages arising directly or indirectly from the use of this information.
This information is for educational purposes only and by receiving this information, you agree with its intended purpose. Nothing contained herein is intended to constitute a recommendation, investment advice, or offer for the purchase or sale of gold, any gold-related products or services or any other products, services, securities or financial instruments (collectively, “Services”). This information does not take into account any investment objectives, financial situation or particular needs of any particular person.
Diversification does not guarantee any investment returns and does not eliminate the risk of loss. The resulting performance of various investment outcomes that can be generated through allocation to gold are hypothetical in nature, may not reflect actual investment results and are not guarantees of future results. WGC does not guarantee or warranty any calculations and models used in any hypothetical portfolios or any outcomes resulting from any such use. Investors should discuss their individual circumstances with their appropriate investment professionals before making any decision regarding any Services or investments.
This information contains forward-looking statements, such as statements which use the words “believes”, “expects”, “may”, or “suggests”, or similar terminology, which are based on current expectations and are subject to change. Forward-looking statements involve a number of risks and uncertainties. There can be no assurance that any forward-looking statements will be achieved. WGC assumes no responsibility for updating any forward-looking statements.
Information regarding QaurumSM and the Gold Valuation Framework
Note that the resulting performance of various investment outcomes that can generated through use of Qaurum, the Gold Valuation Framework and other information are hypothetical in nature, may not reflect actual investment results and are not guarantees of future results. WGC provides no warranty or guarantee regarding the functionality of the tool, including without limitation any projections, estimates or calculations.