Gold ETF Flows: May 2026

Flows shift from flood to trickle

Published:

Highlights

  • Gold ETF flows slowed to a trickle in May, with Europe the only region to register inflows.
  • Global gold ETF AUM declined 2% m/m to US$604bn, while holdings eased to 4,121t, just shy of February’s record high.
  • Gold market liquidity remained robust, with trading volumes slightly higher m/m and still above the 2025 average.

May in review

Global gold-backed ETF investors remained largely sidelined in May as rangebound gold prices and renewed appetite for risk assets limited demand. After April’s notable rebound in activity, global physically backed gold ETFs1 recorded modest outflows of US$2bn, with Europe the only region to register inflows. However, gold ETF flows have remained positive y-t-d, amassing nearly US$17bn. 

Net outflows pushed global gold ETF total assets under management (AUM) down 2% m/m to US$604bn. Collective holdings ticked lower 0.4% to 4,121t, remaining just below the record high of 4,176t reached on 27 February 2026. (Chart 1). 

Chart 1: Global gold ETF flows slowed to a trickle in May

Global gold ETF flows by region and average gold price*

*As of 31 May 2026. Gold price based on the quarterly and monthly average LBMA Gold Price PM in USD.
Source: Bloomberg, Company Filings, ICE Benchmark Administration, World Gold Council

Regional overview

North America turned modestly negative in May, recording outflows of US$1.1bn. Flows have been relatively muted since gold began trading sideways following the March drawdown, suggesting that investors have moved to the sidelines while awaiting a clearer catalyst.

Beyond price action, the opportunity cost of holding gold has also risen amid US dollar strength, higher rates, and adjusted expectations for the future path of US rates. Inflation concerns linked to the US-Iran conflict have added to uncertainty around the rate outlook, with some market commentators suggesting the Fed may need to remain restrictive for longer.

As several of the “easy” consensus macro trades, including gold, played out in Q1, investors who missed the upside or needed to keep pace with benchmarks appear to have rotated back into risk-on sectors such as technology. So far, markets seem to be paying little heed to the risk of a prolonged war in the Middle East.

This rotation is evident through investment flows: global technology ETFs saw their largest monthly inflow since the beginning of 2024 (Chart 2). While concerns over an equity market bubble persist, investors are likely to remain patient until risk-on momentum fades or a broader risk-off unwind prompts renewed safe-haven demand. 

Chart 2: Technology ETFs push gold ETFs aside in May

Global ETF fund flow by equity sector and asset class*

*Data as of 28 May 2026. Global ETF fund flows by equity sector are categorized by Bloomberg. Gold fund flows are calculated using World Gold Council gold-backed ETF data. 
Source: Bloomberg, World Gold Council

Europe was the only region to register inflows, adding US$334mn. Positive flows from the UK and Germany more than offset weakness elsewhere. In the UK, safe-haven demand was supported by political uncertainty and concerns around the government’s fiscal position. At the same time, the second half of the month saw lower Gilt yields – helped by softer inflation and falling oil prices – which reduced the opportunity cost of holding gold and encouraged local ETF demand. A similar dynamic was visible in Germany, where lower oil prices eased concerns over future ECB tightening and helped pull Bund yields lower, supporting gold demand. By contrast, FX-hedged products, mainly in Switzerland, saw outflows as local currencies strengthened against the US dollar during the month. 

Asian funds recorded their first monthly outflow since August 2025, shedding US$1.2bn. The decline was almost entirely driven by China, where a weaker local gold price, a stronger RMB, and sustained optimism toward equities weighed on gold ETF demand. India also saw outflows (US$61mn) during the month, ending its streak of 12 consecutive monthly inflows. Notably, the majority of May’s losses occurred after the announcement of the import duty increase, as investors took profit on the rising domestic gold price.

Funds in other regions saw modest outflows of US$14mn; outflows from Australia offset inflows from countries like South Africa.


Gold ETF flows

Data as of

Demand captures changes in global/regional gold holdings; fund flows capture the net amount of money (in USD) that comes in or out of gold ETFs globally/regionally. See methodology note.

Trading activity inches higher in May

Global gold market trading volumes2 inched higher by 3% m/m to US$424bn/day in May. Volumes remained 15% above the 2025 average of US$368bn/day, signalling ample gold market liquidity despite gold’s recent range-bound performance. 

Over-the-counter volumes increased slightly by 1% in the month to US$243bn/day and remained well above the 2025 average of US$180bn/day. Exchange-traded activity reported positive m/m growth, increasing 6% to US$175bn/day. This modest improvement was driven by higher COMEX activity but partially offset by a decline in Shanghai Futures Exchange volumes. Global gold ETF trading volumes saw a notable reduction of 26% m/m to US$6bn and fell below their 2025 average of US$7bn.

Positioning data pointed to a marginal reduction in total COMEX net longs, which declined 2.5% over the month to 466t.3 Interestingly, managed money positions increased in May over three of the four weeks, adding an additional 17t. However, the overall reduction stemmed from selling in other reportables4, which fell by 29t during the month. Non-reportable positions, often associated with retail activity, showed a similar pattern, with a reduction of roughly 12t. Overall, positioning continues to hover in neutral territory as investors await a clear near-term catalyst, while the long-term fundamental story remains intact. 

Chart 3: Trading volumes rose despite a rangebound gold price

Average daily trading volumes by segment*

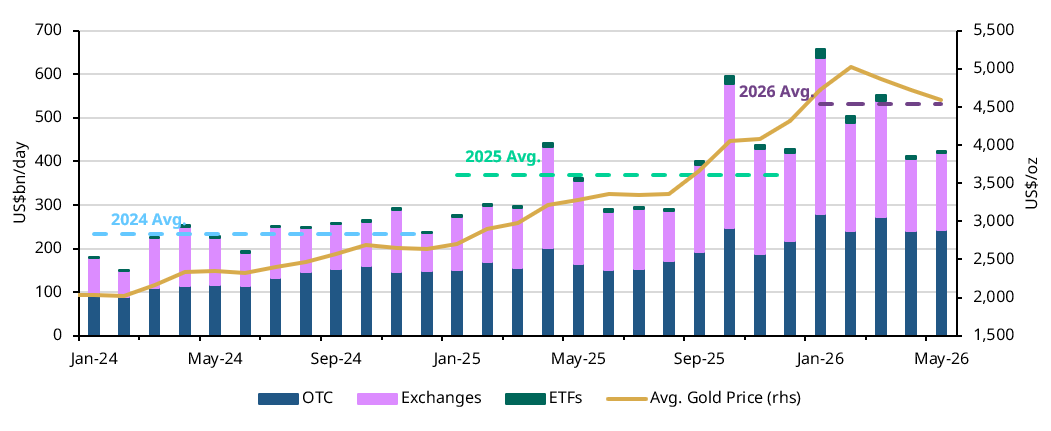
*Data as of 31 May 2026. Gold price based on the monthly average LBMA PM Gold Price USD. 
For more information on trading volumes please visit our Trading Volumes page on Goldhub: Gold Trading Volume | Gold Daily Volume | World Gold Council.
Source: Bloomberg, Nasdaq, COMEX, ICE Benchmark Administration, Shanghai Gold Exchange, Shanghai Futures Exchange, ETF providers, Multi Commodity Exchange of India, Dubai Gold & Commodities Exchange, Japan Exchange Group, Thailand Futures Exchange, Borsa Istanbul, Bursa Malaysia, Korea Exchange, World Gold Council

Footnotes

  1. We define gold ETFs as regulated securities that hold gold in physical form. These include open-ended funds traded on regulated exchanges and other regulated products such as closed-end funds and mutual funds. A complete list is included in the gold ETF section of Goldhub.com.

  2. Due to LBMA trading volume data availability, our full trading volume dataset dates back to 2019.

  3. Based on CFTC positioning report as of 26 May 2026. 

  4. Other reportables refer to reportable traders in the CFTC Commitment of Traders report that do not fall into the Producer/Merchant, Swap Dealer, or Managed Money categories. This group can include institutional or commercial participants with positions large enough to meet reporting thresholds.

Disclaimer [+]Disclaimer [-]