Annual gold demand dips to 4,355.7t

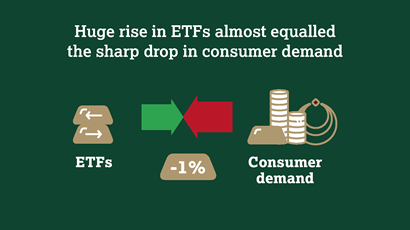
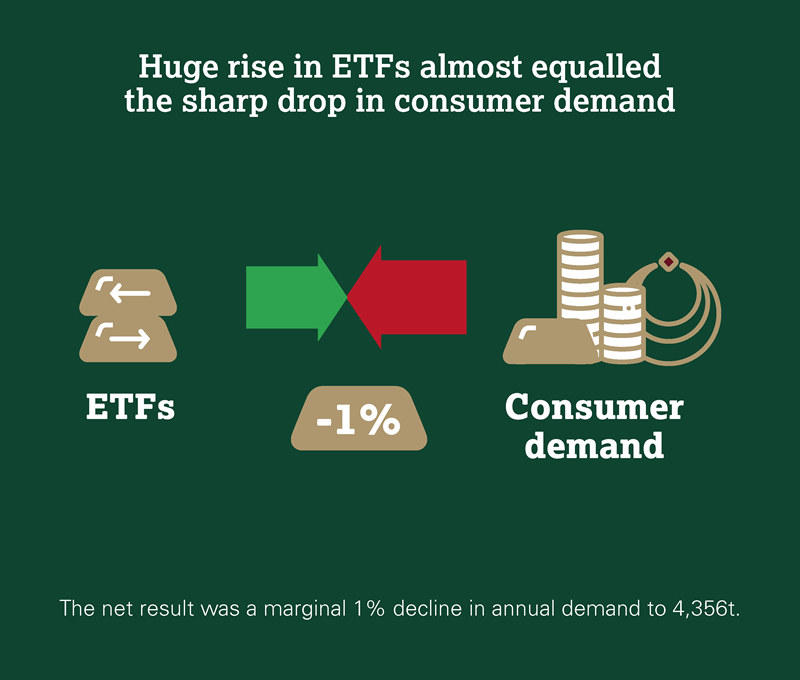
Gold demand fell 1% in 2019 as a huge rise in investment flows into ETFs and similar products was matched by the price-driven slump in consumer demand.

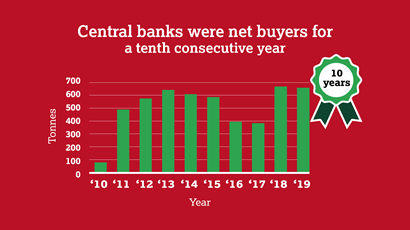
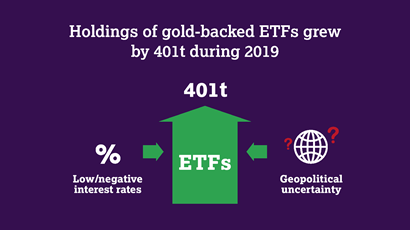
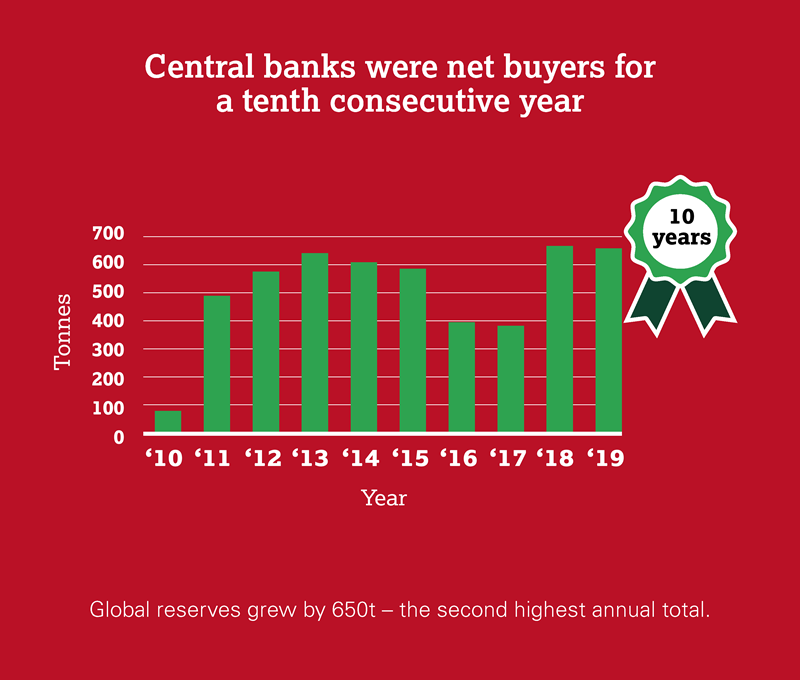
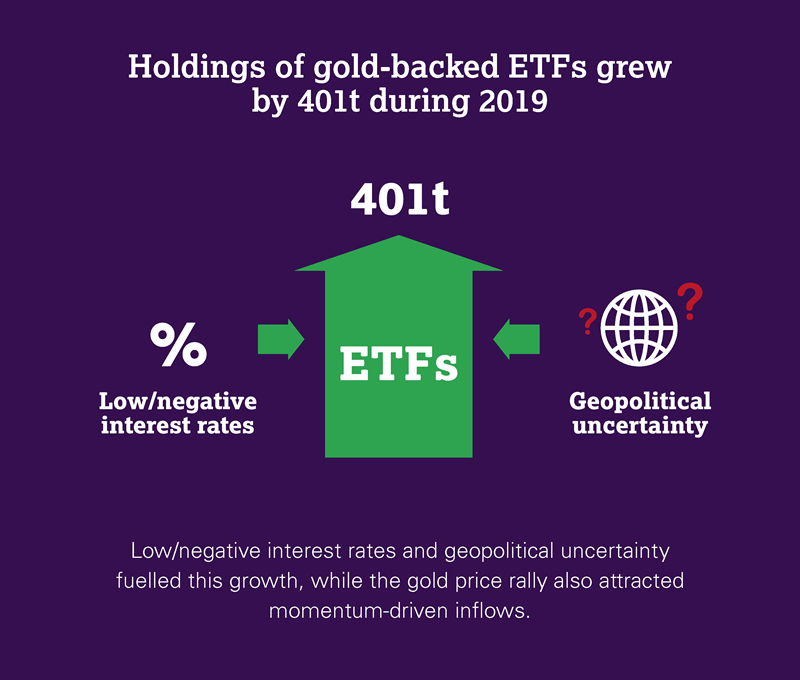
2019 was broadly a year of two distinct halves: resilience/growth across most sectors in the first half of the year contrasted with widespread y-o-y declines in the second. Global demand in H2 was down 10% on the same period of 2018 as y-o-y losses in Q4 compounded those from Q3, notably in jewellery demand and retail bar and coin investment. Central bank demand also slowed in the second half – down 38% in contrast with H1’s 65% increase. But this was partly due to the sheer scale of buying in the preceding few quarters and annual purchases nevertheless reached a remarkable 650.3t – the second highest level for 50 years. ETF investment inflows bucked the general trend. Investment in these products held up strongly throughout the first nine months of the year, reaching a crescendo of 256.3t in Q3. Momentum then subsided in Q4, with inflows slowing to 26.8t (-76% y-o-y). Technology saw modest declines throughout the year, although electronics demand staged a minor recovery in Q4. The annual supply of gold increased 2% to 4,776.1t. This growth came purely from recycling and hedging, as mine production slipped 1% to 3,436.7t.


Huge rise in ETF inflows almost equalled the sharp drop in consumer demand in 2019

Huge rise in ETF inflows almost equalled the sharp drop in consumer demand in 2019

Sources: Metals Focus, World Gold Council; Disclaimer

Highlights

Total fourth quarter demand fell 19% y-o-y to 1,045.2t. Two main contributors to the y-o-y drop were jewellery and physical bar demand, both of which reacted to the elevated gold price. In US dollar value terms, the decline in Q4 demand was much shallower – down just 3% to US$49.7bn.

Inflows into global gold-backed ETFs and similar products pushed total holdings to a record year-end total of 2885.5t. Holdings grew by 401.1t over the year, with 26.8t added in Q4. Inflows were heavily concentrated in Q3 as the US dollar gold price rallied to a six-year high.

Central banks were net buyers for a 10th consecutive year: global reserves grew by 650.3t (-1% y-o-y), the second highest annual total for 50 years. Purchasing in Q4 of 109.6t was 34% lower y-o-y, although this was partly a reflection of the sheer scale of buying in 2018. 

China and India held sway over global consumer demand. Together, the two gold consuming giants accounted for 80% of the y-o-y decline in Q4 jewellery and retail investment demand. High gold prices and a softer economic environment were the main culprits. 

Total annual gold supply edged up 2% to 4,776.1t. An 11% jump in recycling was the main reason for the increase, as consumers capitalised on the sharp rise in the gold price in the second half of the year. Annual mine production was marginally lower at 3,463.7t – the first annual decline for more than 10 years.

The gold price averaged US$1,481/oz in Q4. This was the highest average price since Q1 2013. Although the price remained below the Q3 high, it was well supported. And gold priced in various currencies – including euros, Indian rupees and Turkish lira – hit their highest levels in history. 
 

Disclaimer [+]Disclaimer [-]