Gold Miners Remain Resilient Despite Tighter Margins in Q2’26
10 November, 2026
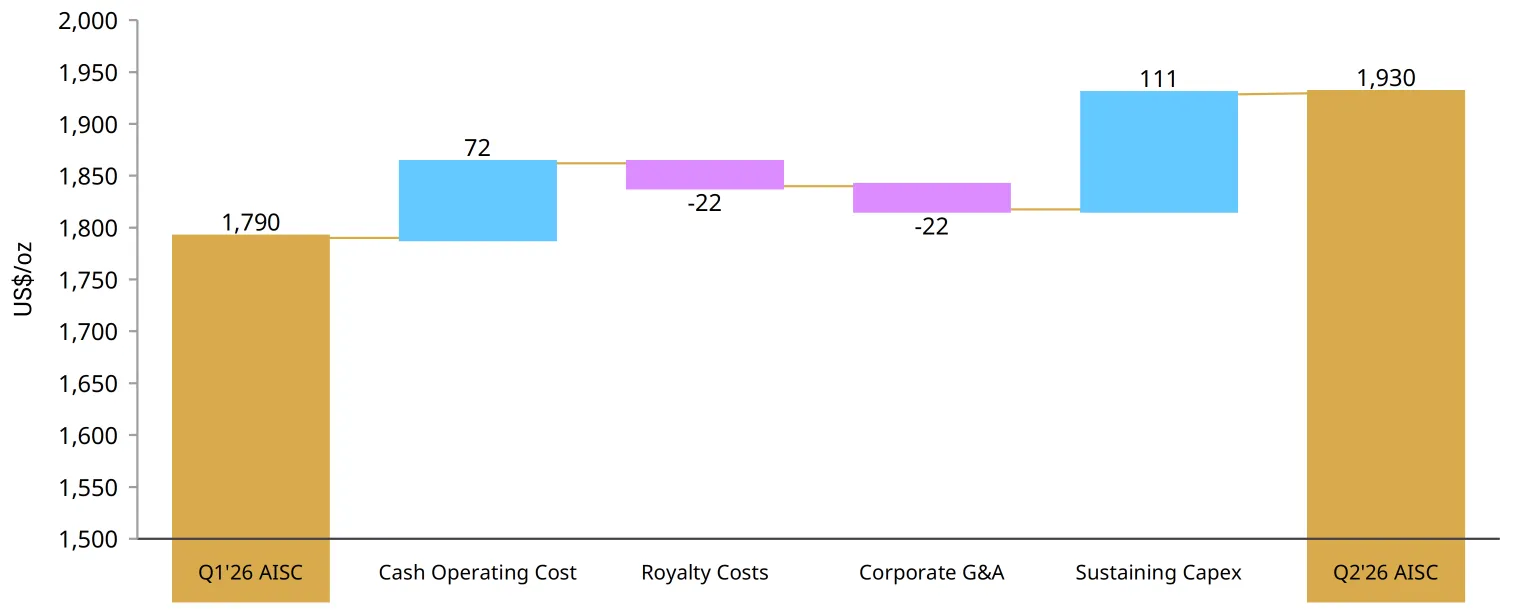
The balance between gold prices and mining costs shifted in Q2’26. After an exceptional opening quarter, lower gold prices coincided with another increase in costs, putting margins under pressure. Global average gold producer All-In Sustaining Costs (AISC) rose by 8% q/q and 22% y/y to a record US$1,930/oz. This marked the 29th consecutive year-on-year increase, underlining the persistence of cost pressures. Higher sustaining capital expenditure, operating expenses and production disruption outweighed lower royalties, although strong cash generation continued to support investment, shareholder returns and resilient balance sheets.
Chart 1: Change in All-in Sustaining Costs was driven by increased sustaining capital and input operating costs
Source: Metals Focus Gold Mine Cost Service
Sustaining Investment and Operational Disruption
Sustaining capex replaced royalties as the principal driver of higher AISC in Q2’26, rising by 34% q/q and 25% y/y to US$441/oz, a record level according to our dataset. The increase was equivalent to around 80% of the US$139/oz q/q net rise in AISC, lifting sustaining capital’s share of the industry’s cost base to 23%, from 18% in Q1’26.
However, spending increases were concentrated in a minority of operations rather than being uniform across the industry. Agnico Eagle’s sustaining expenditure rose by 21% q/q to US$237m, with most of the increase at Detour Lake and Fosterville.1 The timing of expenditure also amplified quarterly fluctuations, as deferred spending raised unit costs without necessarily implying a comparable increase in annual expenditure.
Operational disruption intensified these effects at some operations. At B2Gold’s Goose mine in Canada, catch-up expenditure deferred from Q1’26 coincided with a fire in the crushing circuit. Restricted throughput and lower-than-expected gold sales compounded higher sustaining expenditure, taking AISC to US$6,390/oz.2 Newmont also reported additional costs during downtime at Cadia, in Australia, following a seismic event in April. Lower gold and by-product sales, alongside weaker by-product credits, further increased reported gold costs. The mine returned to normal operations in mid-June, distinguishing temporary setbacks from persistent cost inflation.3
Despite this disruption, production at the operations covered by Metals Focus’ Gold Mine Cost Service recovered by 1.6% q/q and average grades improved by 1.4%. However, on an annual basis, output and grade were lower, by 4.4% and 3.1% y/y respectively.4 Costs therefore rose despite a modest quarterly recovery in output, highlighting the impact of increased expenditure alongside localised operational setbacks.
Operating Costs and Supply-Chain Pressures
Onsite operating expenses also continued to increase. Cash Operating Costs rose by 6% q/q and 18% y/y to US$1,215/oz, while Total Cash Costs increased by 4% q/q and 22% y/y to US$1,406/oz. Labour and fuel remained important pressures. Both Agnico Eagle and AngloGold Ashanti cited higher labour and diesel costs y/y, while Newmont also reported higher diesel prices.5 The supply-chain pressures discussed and anticipated in our Q1 blog continued to reach major producers’ cost bases.6
Fuel contracts and hedges can limit immediate exposure, but replenishment at higher prices may prolong cost pressure. After quarter-end, Agnico Eagle purchased around 70% of its Nunavut diesel requirements through to the 2027 delivery season at prices approximately 30% above its 2026 budget, net of hedges.7 Westgold Resources’ long-term procurement agreements prevented supply interruptions but did not eliminate price exposure. Higher diesel prices added A$12m to its June-quarter costs.8
Supply-chain constraints in Q2’26 not only affected the cost, but also the availability of essential inputs. Delays in obtaining consumables or mobilising equipment can restrict activity, while more expensive supplies raised expenditure on the work that continued. Resolute Mining, for example, reported logistics difficulties, higher fuel and reagent costs, and explosives supply problems at Syama in Mali.9 Energy availability also impacted costs at Evolution Mining’s Mungari in Australia, which reported approximately three days of grid-power outages among factors affecting AISC.10 Reliable procurement and energy supply therefore remained important to both costs and production.
Meanwhile, lower gold prices provided partial support through lower royalties. Average royalty and production-tax costs fell by 11% q/q to US$185/oz, although they remained 53% higher y/y. Their share of AISC eased to 9.6%, from 11.6% in Q1’26. However, lower prices do not reverse fiscal changes: Newmont reported a full quarter of Ghana’s increased royalties, illustrating why relief was uneven across producers.11 Corporate general and administrative costs also fell by 21% q/q to US$82/oz. Together, these reductions softened, but did not offset, higher operating expenses and sustaining capex.
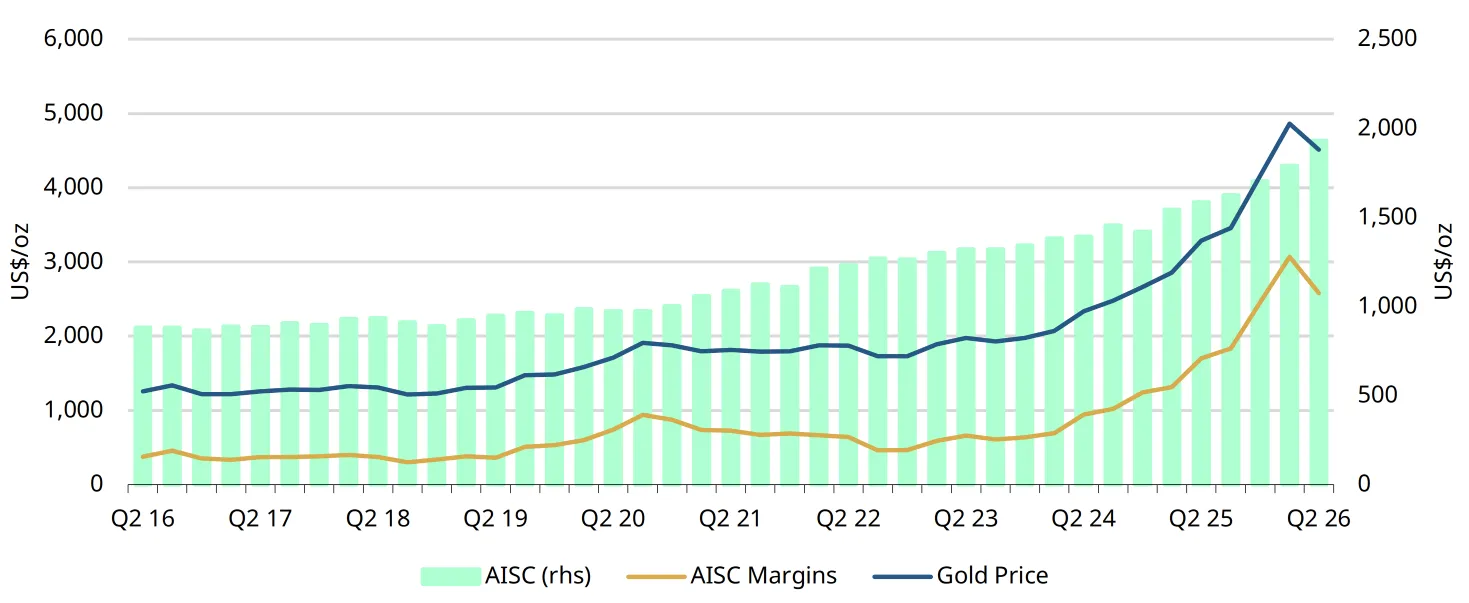
Chart 2: AISC margins have contracted with climbing costs and subdued prices, although remain historically high
Source: Bloomberg, Metals Focus Gold Mine Cost Service
Margins Retreat but Cash Generation Remains Strong
Higher costs coincided with a 7.2% q/q decline in the average gold price to US$4,512/oz. Consequently, average AISC margins contracted by 16% q/q to US$2,582/oz, reversing part of the exceptional expansion seen in Q1’26. Nevertheless, gold prices remained 37% higher y/y and margins were up by 52%. The average margin was still the second highest in our dataset, leaving miners with a substantial cushion despite the quarterly squeeze.
Strong underlying profitability continued to support cash generation, although quarterly outcomes varied. AngloGold Ashanti generated US$727m of free cash flow (FCF), up by 36% y/y, while Kinross generated attributable FCF of US$727m, up by 12% y/y.12 Elsewhere, however, the retreat from Q1’26 was more pronounced. Endeavour Mining’s FCF fell to US$149m from US$613m, reflecting higher tax payments, lower realised gold prices, increased operating costs and greater investing outflows. Even so, the company ended H2’26 with US$254m of net cash, demonstrating resilience despite weaker quarterly cash generation.13
Shareholder distributions continued despite lower quarterly cash generation at some producers. OceanaGold’s FCF declined to US$130m from US$255m in Q1, but it returned US$78m to shareholders, including US$58m through share buybacks.14 Endeavour Mining paid approximately US$200m in dividends and repurchased US$42m of shares during the quarter. These distributions demonstrate the role of accumulated financial resources, rather than current-quarter cash flow alone, in supporting shareholder returns.
Cash was also used to reduce financial risk. AngloGold Ashanti repurchased approximately US$666m principal of outstanding bonds in April, lowering gross debt and future interest obligations, and ended June with US$991m of net cash.15 Newmont, Agnico Eagle and Kinross ended June with reported net cash of US$3.4bn, US$3.3bn and US$1.9bn, respectively.16 These balance sheets provide flexibility to maintain investment and distributions through weaker prices or operational disruption. The margin contraction increased the importance of cost control without eliminating the financial strength built during the gold-price upswing.
Outlook
Q2’26 marked a retreat from exceptional margins rather than a collapse in cash generation. Gold prices remained high by historical standards and miners’ balance sheets remained robust. As AISC approaches US$2,000/oz, expensive fuel purchases, continuing supply-chain and inflationary pressures are expected to sustain cost increases. Meanwhile, the gold price averaged US$4,266/oz in Q3’26, down by 5.5% q/q, and stood at around US$4,040/oz at the time of writing. Combined with rising costs, this sets the stage for further margin contraction over the remainder of 2026. Looking ahead to 2027, a forecast recovery in gold prices would lift royalty costs but this should be more than offset through higher revenues, supporting wider margins and further strengthening miners’ financial positions.
Footnotes
1Agnico Eagle, Q2 2026 results
4Metals Focus Gold Mines Cost Service
5AngloGold Ashanti Q2 2026 Earnings Release; Agnico Eagle, Q2 2026 results; Newmont, Q2 2026 results
6Record gold prices outpace rising mining costs in Q1’26
7Agnico Eagle, Q2 2026 results
8Westgold Resources June 2026 Quarterly Results
9Resolute, June 2026 Quarterly Report
10Evolution Mining June 2026 Quarterly Report
12AngloGold Ashanti Q2 2026 Earnings Release; Kinross, Q2 2026 results
13Endeavour Mining H1 2026 Results
15AngloGold Ashanti Q2 2026 Earnings Release
16Newmont, Q2 2026 results; Agnico Eagle, Q2 2026 results; Kinross, Q2 2026 results.
Disclaimer
Important information and disclaimers
© 2026 World Gold Council. All rights reserved. World Gold Council and the Circle device are trademarks of the World Gold Council or its affiliates.
All references to LBMA Gold Price are used with the permission of ICE Benchmark Administration Limited and have been provided for informational purposes only. ICE Benchmark Administration Limited accepts no liability or responsibility for the accuracy of the prices or the underlying product to which the prices may be referenced. Other content is the intellectual property of the respective third party and all rights are reserved to them.
Reproduction or redistribution of any of this information is expressly prohibited without the prior written consent of World Gold Council or the appropriate copyright owners, except as specifically provided below. Information and statistics are copyright © and/or other intellectual property of the World Gold Council or its affiliates or third-party providers identified herein. All rights of the respective owners are reserved.
The use of the statistics in this information is permitted for the purposes of review and commentary (including media commentary) in line with fair industry practice, subject to the following two pre-conditions: (i) only limited extracts of data or analysis be used; and (ii) any and all use of these statistics is accompanied by a citation to World Gold Council and, where appropriate, to Metals Focus or other identified copyright owners as their source. World Gold Council is affiliated with Metals Focus.
The World Gold Council and its affiliates do not guarantee the accuracy or completeness of any information nor accept responsibility for any losses or damages arising directly or indirectly from the use of this information.
This information is for educational purposes only and by receiving this information, you agree with its intended purpose. Nothing contained herein is intended to constitute a recommendation, investment advice, or offer for the purchase or sale of gold, any gold-related products or services or any other products, services, securities or financial instruments (collectively, “Services”). This information does not take into account any investment objectives, financial situation or particular needs of any particular person.
Diversification does not guarantee any investment returns and does not eliminate the risk of loss. Past performance is not necessarily indicative of future results. The resulting performance of any investment outcomes that can be generated through allocation to gold are hypothetical in nature, may not reflect actual investment results and are not guarantees of future results. The World Gold Council and its affiliates do not guarantee or warranty any calculations and models used in any hypothetical portfolios or any outcomes resulting from any such use. Investors should discuss their individual circumstances with their appropriate investment professionals before making any decision regarding any Services or investments.
This information may contain forward-looking statements, such as statements which use the words “believes”, “expects”, “may”, or “suggests”, or similar terminology, which are based on current expectations and are subject to change. Forward-looking statements involve a number of risks and uncertainties. There can be no assurance that any forward-looking statements will be achieved. World Gold Council and its affiliates assume no responsibility for updating any forward-looking statements.
Information regarding the LBMA Gold Price
The LBMA Gold Price is used by the World Gold Council with permission under license by ICE Benchmark Administration Limited and is subject to the restrictions set forth here (www.gold.org/terms-and-conditions).
Information regarding QaurumSM and the Gold Valuation Framework
Note that the resulting performance of various investment outcomes that can be generated through use of Qaurum, the Gold Valuation Framework and other information are hypothetical in nature, may not reflect actual investment results and are not guarantees of future results. Neither World Gold Council (including its affiliates) nor Oxford Economics provides any warranty or guarantee regarding the functionality of the tool, including without limitation any projections, estimates or calculations.
Information from ICRA Analytics Limited
All information obtained from ICRA Analytics Limited contained in this document is subject to the disclaimer set forth here (www.icraanalytics.com/terms-of-use/disclaimer).