India gold market update: Cautious festive optimism
17 September, 2026
Highlights
- International and domestic gold prices1 surged in August before pulling back in September; domestic market discounts widened
- While price swings weighed on overall jewellery demand, wedding-related buying remained resilient and physical investment demand stayed steady
- Gold ETF demand remained positive in August, despite a slowdown in the pace of new investors; digital gold buying also maintained momentum, averaging 1.6t per month from June to August
- Gold futures trading hit a five-month high, while gold imports moderated during the month.
Looking ahead
- Demand is expected to improve as the festive and wedding season progresses, supported by steady investment demand and resilient wedding-related buying, though elevated prices and volatility may continue to constrain discretionary buying.
Gold rally moderates after strong August gains
Gold prices recorded one of their strongest monthly gains in nearly three decades in August, with the LBMA Gold Price PM rising 13% to end the month at US$4,386/oz, slightly lower than the 14% gain recorded in January. Strong investment flows and a softer US dollar were key drivers of the rally. Domestic gold prices broadly mirrored the global trend, rising 12% during the month to INR158,854/10g, although gains were slightly tempered by the marginal appreciation of the INR. Both international and domestic prices have pulled back in September,2 declining 3.9% and 4.6% respectively, amid shifting expectations around Fed policy and softer global gold ETF flows.
Chart 1: August rally eases
Month-end LBMA Gold Price PM and MCX spot gold price changes and movement*
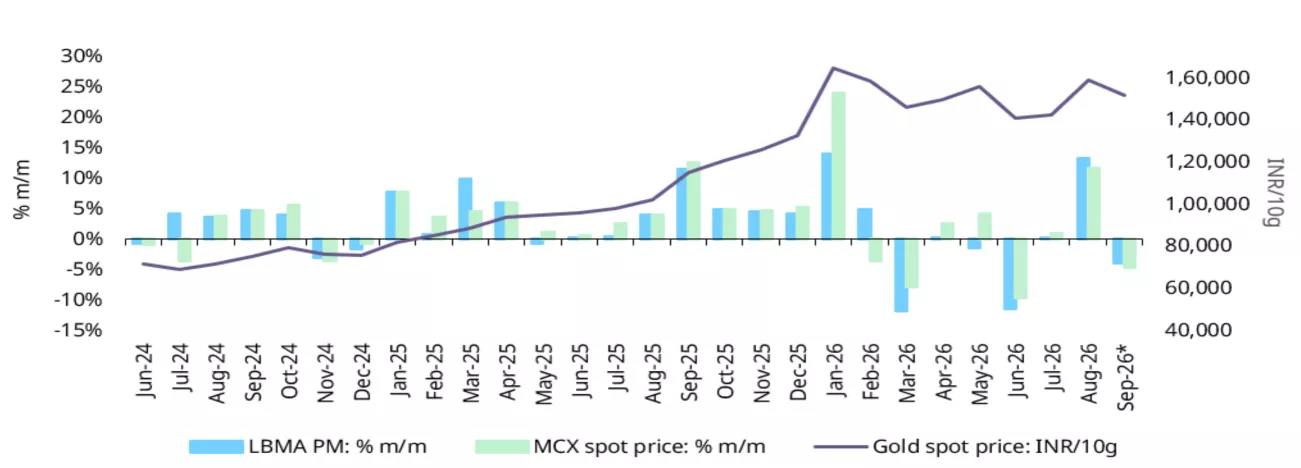
*As of 11 September, 2026.
Source: Bloomberg, World Gold Council
Domestic gold prices continue to trade below import parity,3 suggesting that local supply remains adequate relative to demand. Discounts widened from an average US$34/oz in July to US$51/oz in August and further to US$78/oz as of 11 September, leaving domestic prices trading nearly 2% below import parity or landed price. Market feedback suggests that the exchange of old gold for new jewellery has boosted local supply and helped keep domestic prices below the landed cost. The availability of unofficial supply is also cited as a contributing factor behind the widening discount.
Chart 2: Domestic gold trades below import parity
NCDEX gold premium/discount relative to the official domestic price*
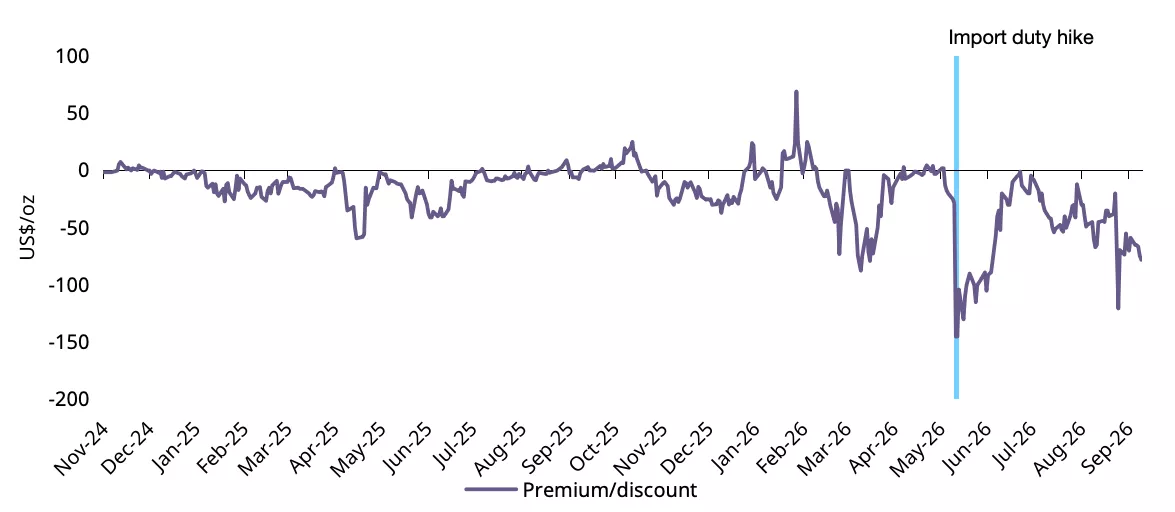
*As of 11 September 2026.
Source: NCDEX, World Gold Council
Festive season off to a cautious start
Industry feedback suggests that the strength in gold jewellery demand seen in the run-up to the festive season, which began in late August, has softened over recent weeks. The sharp gold price rally in August, followed by the subsequent pullback, has left many consumers in a wait-and-watch mode, delaying discretionary purchases. Retailers have also been cautious about inventory building, preferring to replenish based on realised demand, while some manufacturers have reported delays in uptake of orders by retailers. Wedding-related demand, however, has remained relatively resilient, although anecdotal reports point to a structural shift towards lighter-weight jewellery. The large retailers have seen comparatively stronger demand and have stepped up product launches, marketing initiatives and promotional campaigns, while also refining their strategies to favour faster-moving products.
Despite the recent moderation, the trade remains cautiously optimistic about demand during the peak festive and wedding season. Market participants report that physical investment demand remains steady, although some investors appear to be shifting from physical gold towards digital forms of gold.
Gold ETF accumulation continues
Inflows into Indian gold ETFs rose 67% m/m to INR25.97bn (US$272mn) in August, according to data from the Association of Mutual Funds of India (AMFI). In volume terms, holdings increased by 1.6t, taking cumulative ETF holdings to 121.3t, while cumulative AUM rose to INR1,912bn (~US$20bn). Although inflows remain well below the exceptionally strong levels seen in Q1, they have stayed positive on a near-sustained basis throughout the year, underscoring investor appetite for gold as a portfolio allocation. The moderation from earlier highs likely reflects periodic profit taking and softer price momentum. Limits on large direct subscriptions may also have contributed to the slowdown.
Investor participation has also softened, with around 4,000 new folios (accounts) added in August, taking total folios to 12.54mn, notably lower than the average monthly increase of 330k from January to July. This suggests that while existing investors continue to accumulate gold through ETFs, the pace of new investor entry has slowed.
Chart 3: Sustained positive inflows
Gold ETF flows in INRbn, and total holdings in tonnes*
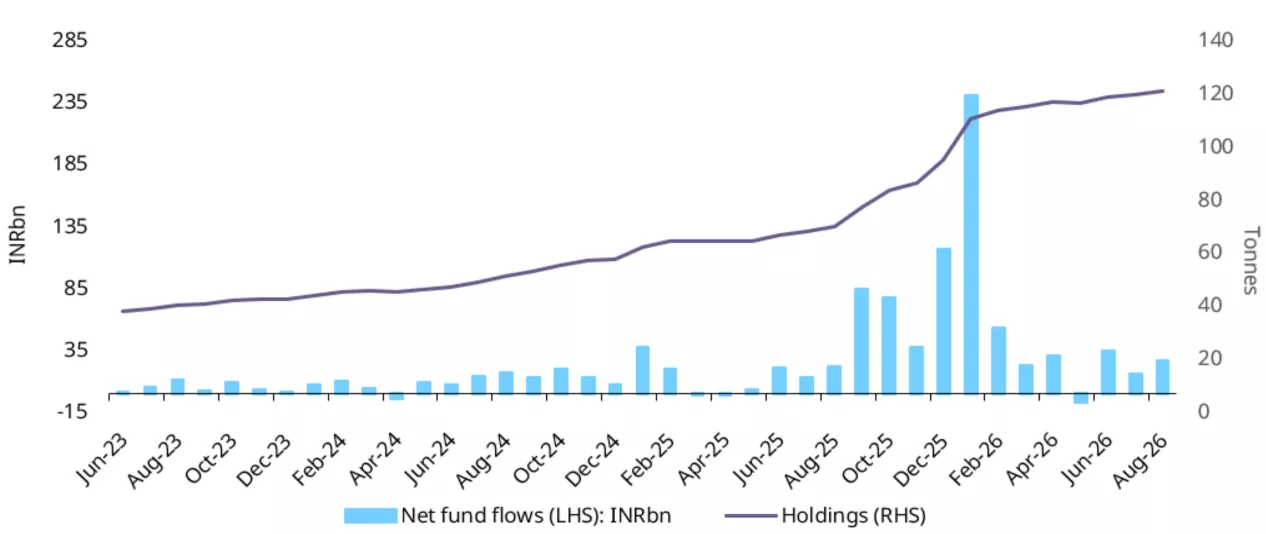
*As of end August 2026.
Digital gold buying holds steady
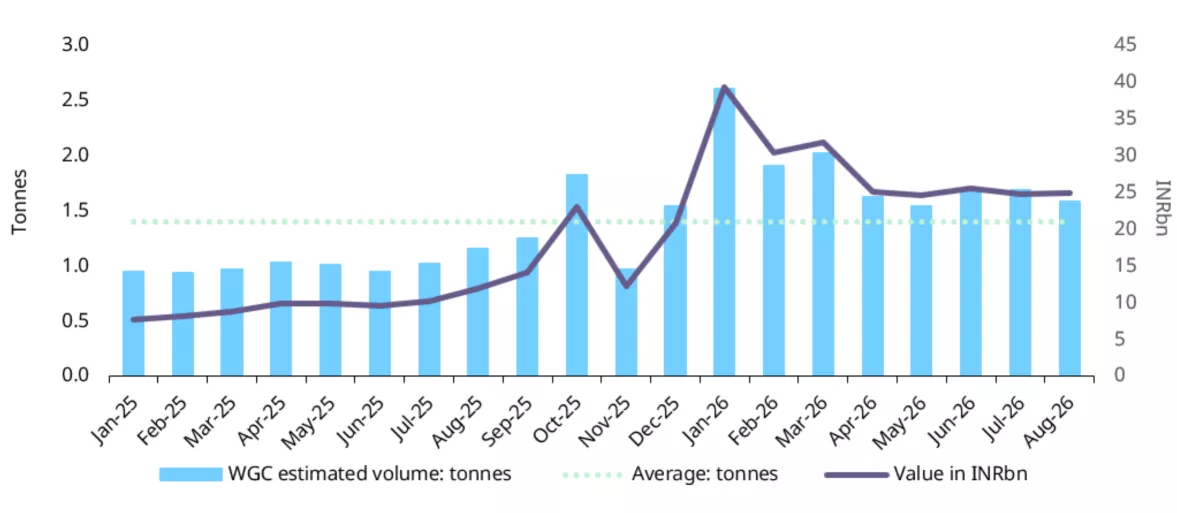
Digital gold buying held steady from June to August, averaging around INR25bn (US$262mn) per month. While monthly purchases were broadly stable over the period, demand was significantly higher than a year earlier, with August purchases up 110% y/y, highlighting the growing appeal of digital gold. In volume terms, purchases averaged 1.6t per month from June to August. The steady pace of buying points to continued adoption of digital gold, supported by its fractional nature, ease of access and suitability for regular accumulation.
Chart 4: Resilient digital gold buying
Purchase of digital gold, by value and estimated volume
Source: NPCI, World Gold Council
Futures markets sees stronger participation
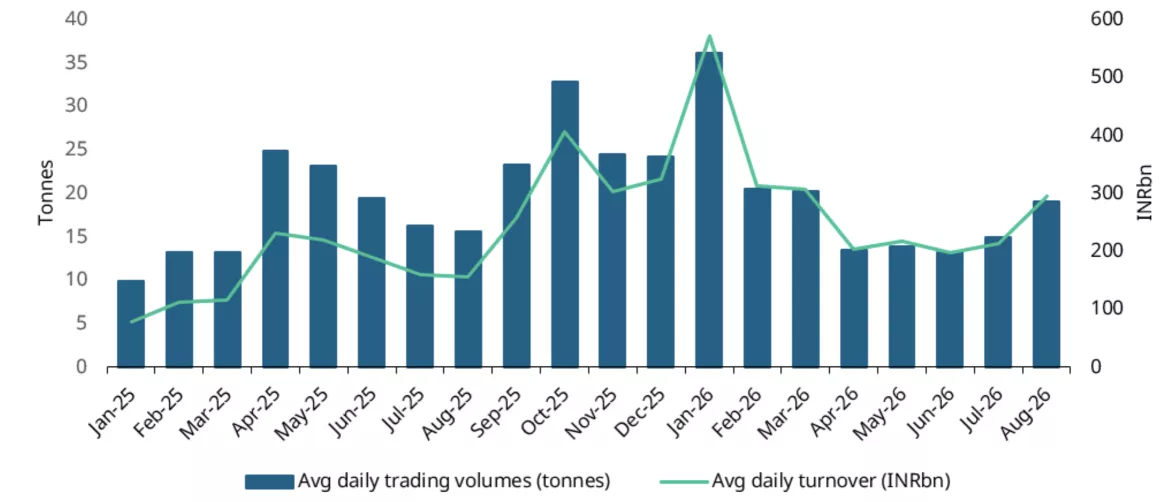
Gold futures trading in India saw a notable pickup in August, broadly mirroring the increase in activity in global gold markets. On the Multi-Commodity Exchange (MCX) average daily turnover rose 38% m/m to INR295bn (US$3.1bn), the highest in five months, while average daily volumes rose 27% m/m to 19t. The rise in trading coincided with gold’s strong price rally during the month, which likely prompted greater hedging as well as tactical trading, boosting overall liquidity and market interest. Despite the monthly improvement, turnover and volumes remained 48% below their January peak.
Chart 5: Gold Futures see increased trading interest
Gold futures trading on MCX; volume and turnover
Source: MCX India, World Gold Council
Import activity slows
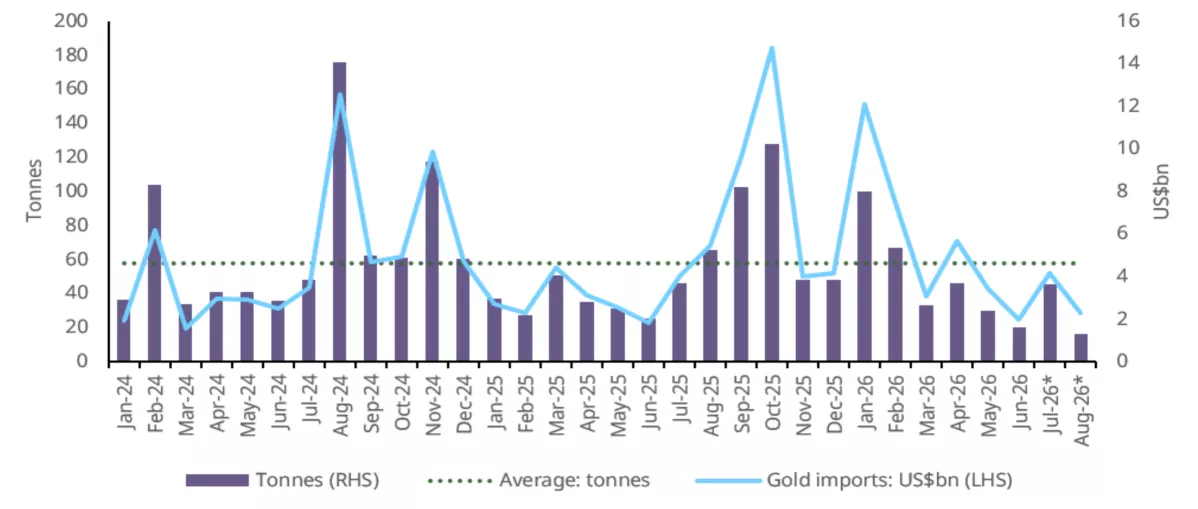
Gold imports declined sharply in August, falling to US$2.3bn, down 45% m/m and 58% y/y. Import volumes (gross) are estimated to have been in the range of 15-20t, while gold's share of total merchandise imports eased to 3%, compared with 9% a year earlier. This fall in imports suggests that existing domestic supply remained sufficient to meet expected demand. Lower imports may also partly reflect lower doré shipments. With domestic gold prices trading at a discount of more than 1% to import parity during the month, and given that doré imports have a 0.65% duty advantage over bullion, such discounts likely made imported doré economically less attractive for local refiners.
Chart 6: Imports weaken
Monthly gold imports in tonnes and US$bn*
*Includes World Gold Council estimates.
Source: Ministry of Commerce and Industry, CMIE, World Gold Council
Disclaimer
Important information and disclaimers
© 2026 World Gold Council. All rights reserved. World Gold Council and the Circle device are trademarks of the World Gold Council or its affiliates.
All references to LBMA Gold Price are used with the permission of ICE Benchmark Administration Limited and have been provided for informational purposes only. ICE Benchmark Administration Limited accepts no liability or responsibility for the accuracy of the prices or the underlying product to which the prices may be referenced. Other content is the intellectual property of the respective third party and all rights are reserved to them.
Reproduction or redistribution of any of this information is expressly prohibited without the prior written consent of World Gold Council or the appropriate copyright owners, except as specifically provided below. Information and statistics are copyright © and/or other intellectual property of the World Gold Council or its affiliates or third-party providers identified herein. All rights of the respective owners are reserved.
The use of the statistics in this information is permitted for the purposes of review and commentary (including media commentary) in line with fair industry practice, subject to the following two pre-conditions: (i) only limited extracts of data or analysis be used; and (ii) any and all use of these statistics is accompanied by a citation to World Gold Council and, where appropriate, to Metals Focus or other identified copyright owners as their source. World Gold Council is affiliated with Metals Focus.
The World Gold Council and its affiliates do not guarantee the accuracy or completeness of any information nor accept responsibility for any losses or damages arising directly or indirectly from the use of this information.
This information is for educational purposes only and by receiving this information, you agree with its intended purpose. Nothing contained herein is intended to constitute a recommendation, investment advice, or offer for the purchase or sale of gold, any gold-related products or services or any other products, services, securities or financial instruments (collectively, “Services”). This information does not take into account any investment objectives, financial situation or particular needs of any particular person.
Diversification does not guarantee any investment returns and does not eliminate the risk of loss. Past performance is not necessarily indicative of future results. The resulting performance of any investment outcomes that can be generated through allocation to gold are hypothetical in nature, may not reflect actual investment results and are not guarantees of future results. The World Gold Council and its affiliates do not guarantee or warranty any calculations and models used in any hypothetical portfolios or any outcomes resulting from any such use. Investors should discuss their individual circumstances with their appropriate investment professionals before making any decision regarding any Services or investments.
This information may contain forward-looking statements, such as statements which use the words “believes”, “expects”, “may”, or “suggests”, or similar terminology, which are based on current expectations and are subject to change. Forward-looking statements involve a number of risks and uncertainties. There can be no assurance that any forward-looking statements will be achieved. World Gold Council and its affiliates assume no responsibility for updating any forward-looking statements.
Information regarding the LBMA Gold Price
The LBMA Gold Price is used by the World Gold Council with permission under license by ICE Benchmark Administration Limited and is subject to the restrictions set forth here (www.gold.org/terms-and-conditions).
Information regarding QaurumSM and the Gold Valuation Framework
Note that the resulting performance of various investment outcomes that can be generated through use of Qaurum, the Gold Valuation Framework and other information are hypothetical in nature, may not reflect actual investment results and are not guarantees of future results. Neither World Gold Council (including its affiliates) nor Oxford Economics provides any warranty or guarantee regarding the functionality of the tool, including without limitation any projections, estimates or calculations.
Information from ICRA Analytics Limited
All information obtained from ICRA Analytics Limited contained in this document is subject to the disclaimer set forth here (www.icraanalytics.com/terms-of-use/disclaimer).
Footnotes
1LBMA Gold Price PM and MCX spot gold price as of 11 September 2026.
2As of 11 September 2026.
3Import parity or landed price is the international gold price (LBMA Gold Price AM) adjusted for import tax.
