China gold market update: December demand rebounds
15 January, 2026
Highlights
- Gold extended its strength in December, concluding 2025 with its best annual performance in decades for both the Shanghai Benchmark Gold Price PM (SHAUPM) in RMB and the LBMA Gold Price PM in USD
- December wholesale demand rebounded seasonally, although 2025 saw the third consecutive year of declines – gold jewellery weakness more than offset robust investment
- Chinese gold ETFs have witnessed inflows for four months in a row, ending 2025 as the best year ever – total assets under management (AUM) surged 243% to RMB242bn (US$35bn) and holdings more than doubled to 248t; meanwhile, gold futures volumes at the Shanghai Futures Exchange (SHFE) reached their highest on record
- The People’s Bank of China (PBoC) has announced gold purchases every month in 2025, ending the year with a 27t addition and pushing China’s official gold holdings to 2,306t, 8.5% of total reserves.
Looking ahead
- China’s gold market has undergone a period of significant change in 2025, marked by notable divergence in gold jewellery consumption and investment demand. We will release our full-year 2025 Gold Demand Trends report later this month, in which we review 2025 and look ahead to 2026; please stay tuned for publication.
A strong year ends with a positive December
Global gold prices carried their strength into the last month of 2025, ending the year with performances unseen for decades. Elevated geopolitical risks, strong option market activity and robust ETF inflows all supported gold. The LBMA Gold Price PM in USD and the Shanghai Benchmark Gold Price PM (SHAUPM) in RMB rose 4.2% and 2.8% respectively (Chart 1); the sizable RMB appreciation against the dollar once again limited the SHAUPM’s increase in the month.
Chart 1: Gold kept rising in December, concluding another robust year
Monthly returns of the SHAUPM in RMB and LBMA Gold Price PM in USD*
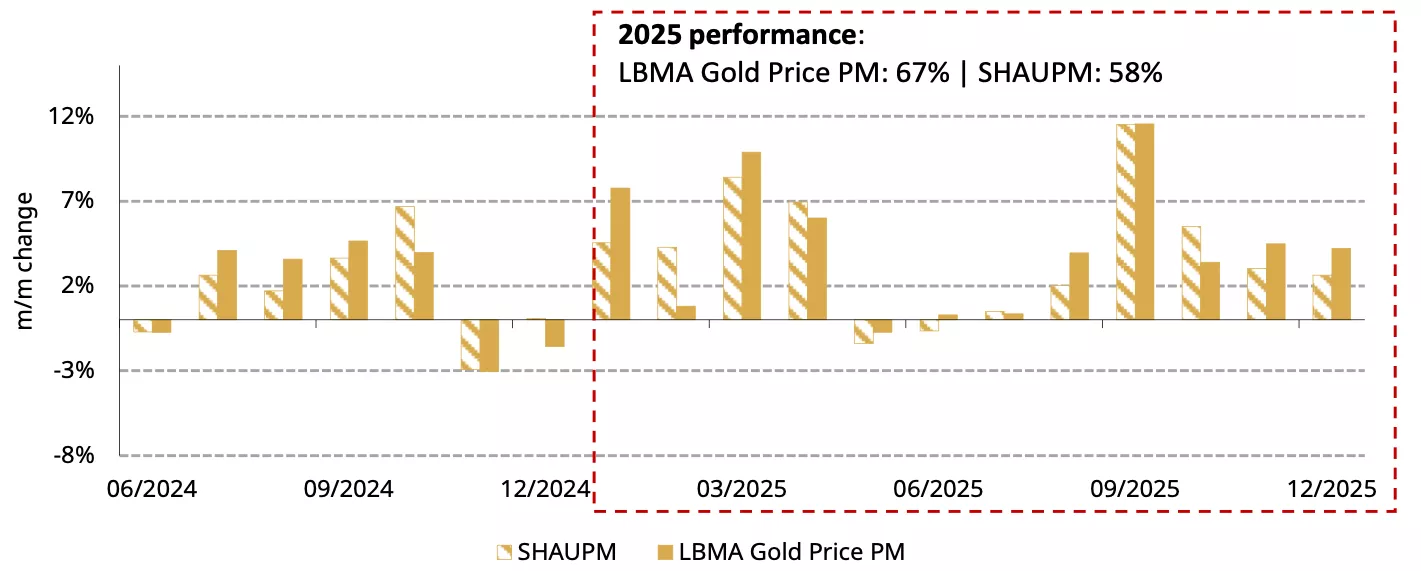
*Data to 31 December 2025.
Source: Shanghai Gold Exchange, World Gold Council
The RMB gold price registered its strongest annual performance since 2002 – when the SGE was established – surging 58% (Chart 2).1 Meanwhile its USD peer rocketed 67%, its best year since 1979. The notable appreciation in the RMB against the dollar and weaker physical gold demand – mainly in the jewellery sector – curbed Chinese gold price strength.
Chart 2: 2025 marks a record year for the RMB gold price
Cumulative monthly returns of the RMB gold price*
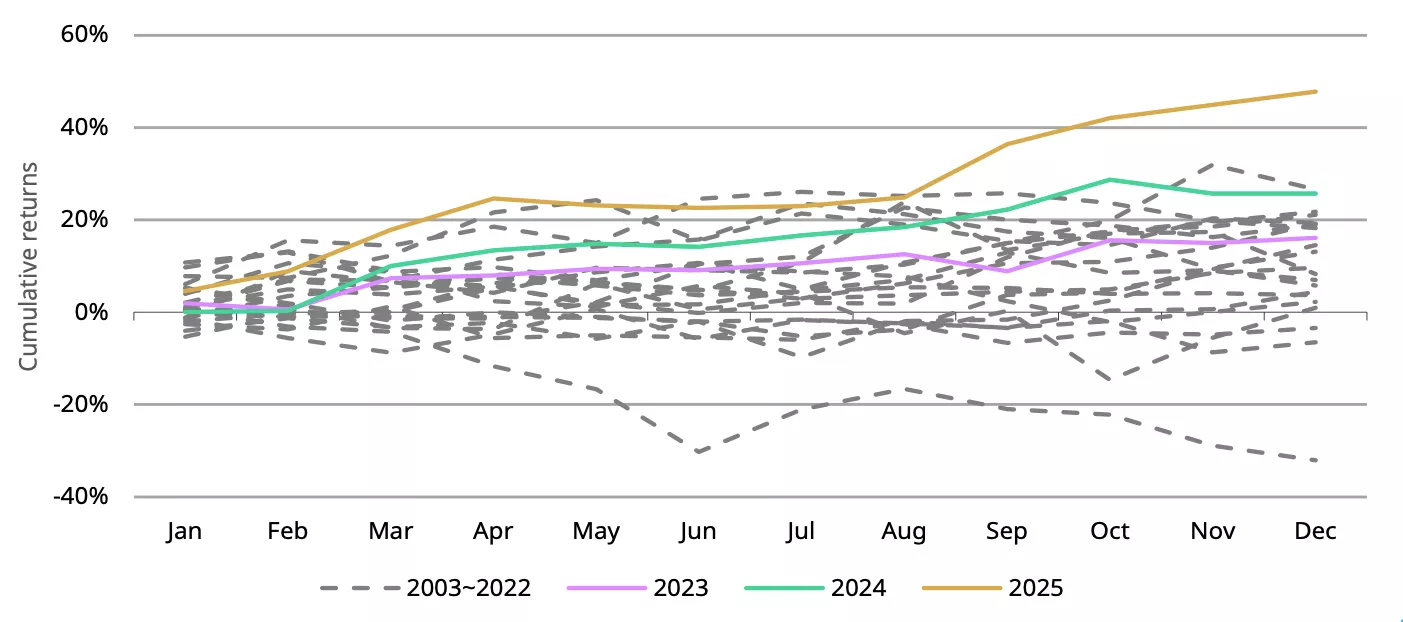
*Based on Au99.99 price dating back to October 2002 when the SGE was established. Data between January 2003 and December 2025.
Source: Shanghai Gold Exchange, World Gold Council
Wholesale gold demand rebounded in December but declined in 2025 overall
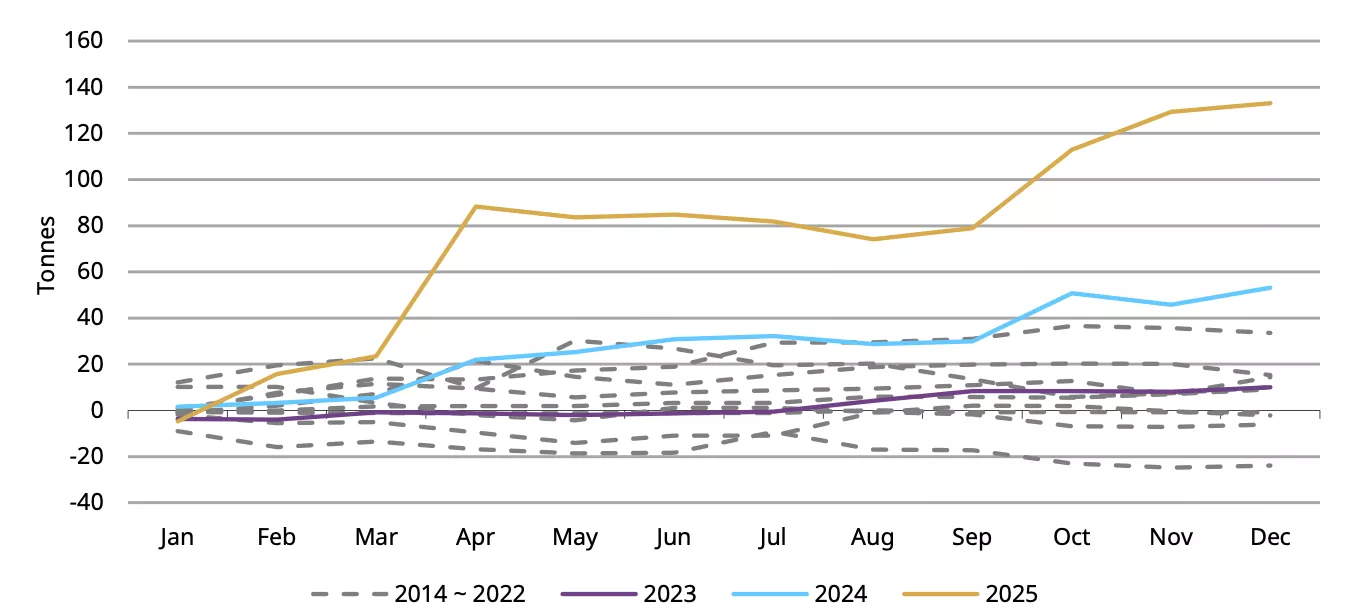
115t of gold was shipped out of the SGE during December, 36% higher m/m (Chart 3). Conversations with market participants indicate that wholesale demand for gold jewellery picked up in the second half of the month as price momentum paused and retailers prepared for year-end sales – a seasonal factor that usually lifts December demand.
While pressure from the VAT reform remains – with its additional tax burden on gold jewellery – consumers and jewellers have started to adapt to the changing environment and sales have begun to normalise from November’s initial panic when the reform was announced. But there was still a 6% y/y decline in December’s wholesale gold demand, due to pressure from the rocketing gold price as well as the VAT reform.
Chart 3: December wholesale demand improved
Monthly gold withdrawals from the SGE*
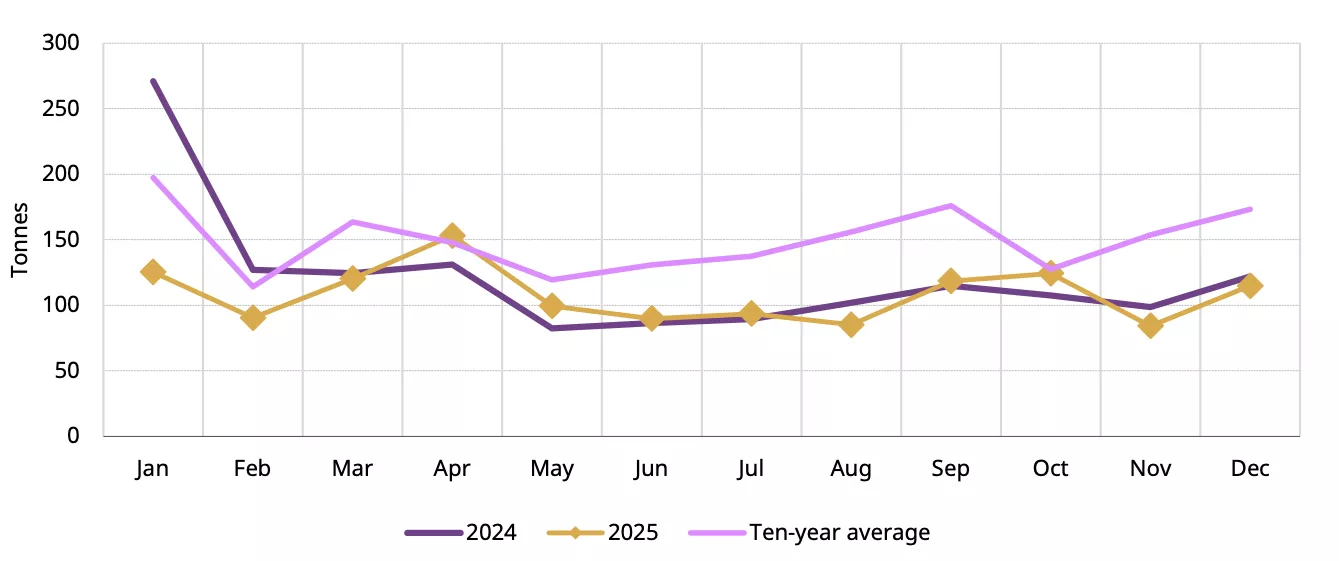
*The 10-year average is based on data between 2015 and 2024.
Source: Shanghai Gold Exchange, World Gold Council
Gold withdrawals from the SGE totalled 1,298t in 2025, 11% lower y/y and 28% below the ten-year average (Chart 4). Weakness in the gold jewellery sector outpaced investment strength and wholesale demand declined as a result. The surging gold price, changing tax policies and various risks have all shaped the 2025 Chinese gold demand picture. For detailed analysis, please stay tuned for our upcoming 2025 full-year Gold Demand Trends.
Chart 4: Wholesale gold demand declined further in 2025
Annual gold withdrawals from the SGE*
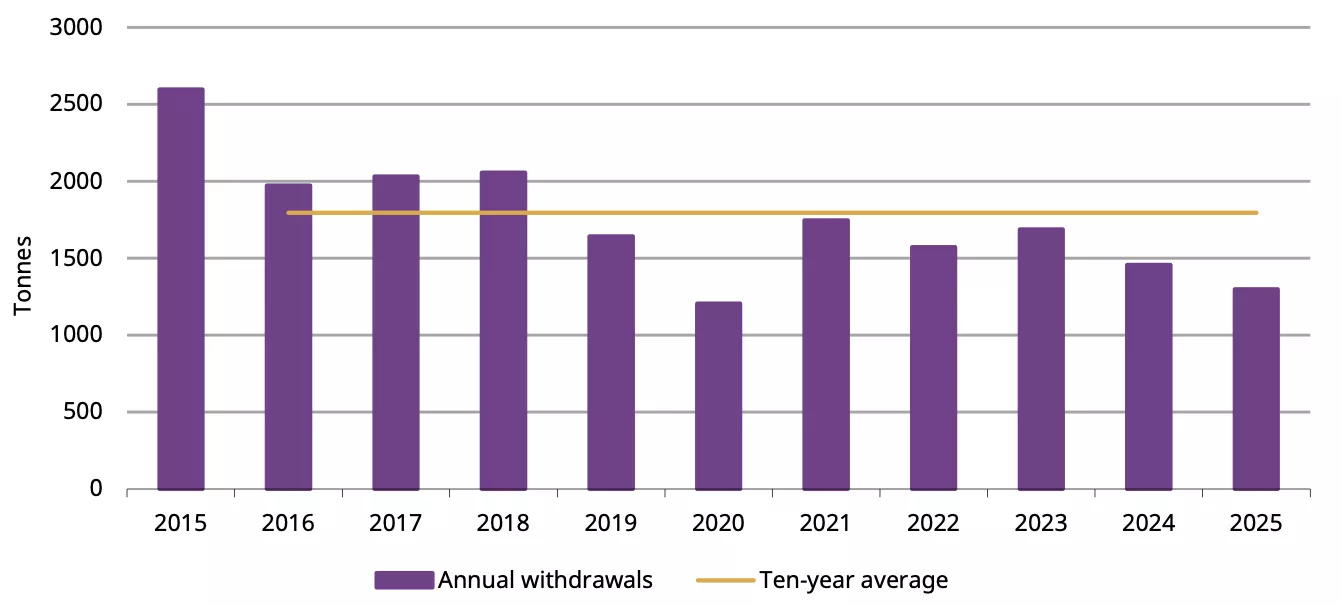
*The 10-year average is based on data between 2015 and 2024.
Source: Shanghai Gold Exchange, World Gold Council
Chinese gold ETFs experienced a record year
Chinese gold ETFs have seen inflows for four consecutive months, adding RMB3.9bn (US$545mn, 3.8t) in December. We believe that continued strength in the gold price and elevated global geopolitical tensions have been key drivers.
Chinese investors bought RMB112bn (US$15.5bn, 133t) of gold ETFs during 2025, marking the strongest annual inflow ever (Chart 5). The unprecedent local gold price performance, as well as heightened global trade and geopolitical risks, lit up investor interest. The record inflows and the price rally brought Chinese gold ETFs’ total AUM to RMB242bn (US$34.6bn) by the end of the year, up 243% from 2024. Meanwhile, holdings more than doubled (+116%) to 248t – both reached their highest in history.
Chart 5: Chinese gold ETFs recorded their strongest year ever
Cumulative monthly gold ETF demand*
*Data to 31 December 2025.
Source: Company filings, World Gold Council
Gold futures trading volumes averaged 390t per day in December, 15% lower m/m yet still well above the five-year average of 216t/day. Gold price volatility remained the key factor to impact trader interest. In 2025 as a whole, gold futures volumes reached 457t/day on average, a 52% rise y/y and the highest ever (Chart 6). The strong gold price rally and rising risk hedging needs attracted attention from traders as well as industrial participants, significantly pushing up volumes.
Chart 6: Gold futures volumes set a record year
Daily average trading volumes of SHFE gold futures and the active gold futures price*
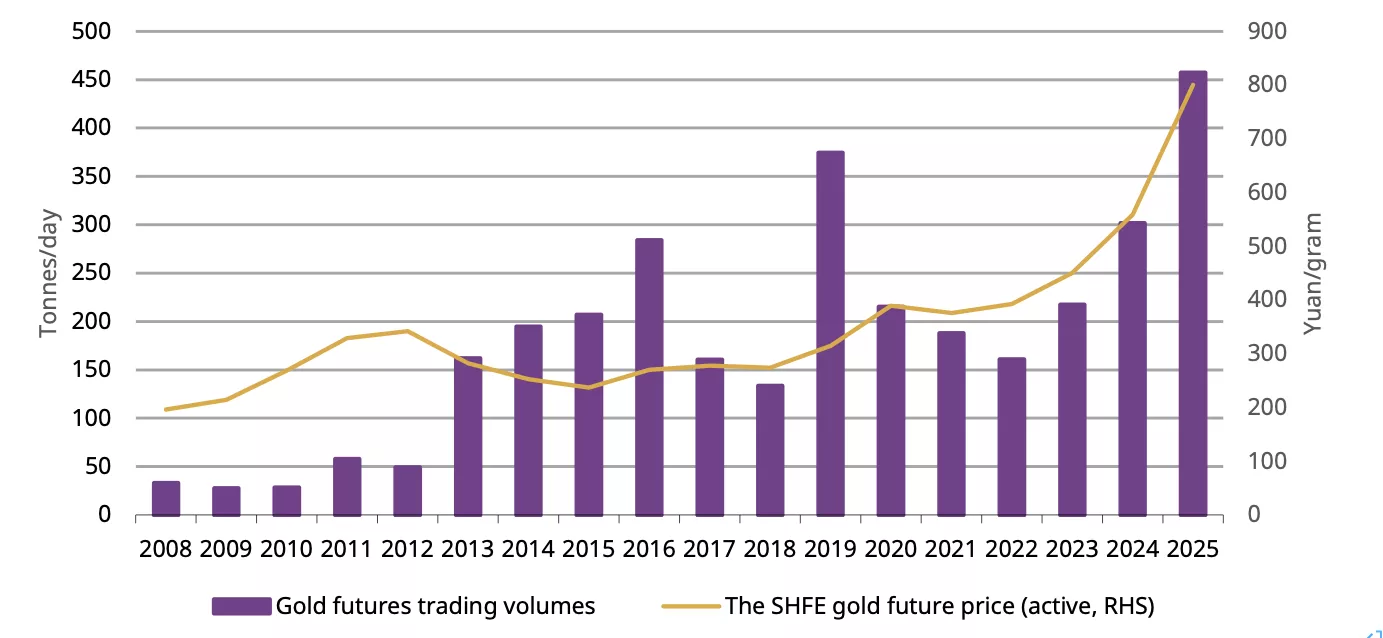
*As of 31 December 2025.
Source: Shanghai Futures Exchange, World Gold Council
China’s gold reserves increased every month in 2025
The PBoC reported a gold purchase for the 14th consecutive month, adding a further 0.9t in December (Chart 7). By the end of 2025 the country’s official holdings had reached 2,306t, accounting for 8.5% of total foreign exchange reserves. Notably, gold purchase announcements were made every month, totalling 27t during the year. We believe such announcements have encouraged retail investors to buy gold, contributing to the strength in bullion sales and to gold ETF demand.
Chart 7: The upward trend in China’s official gold holdings now extends to 14 months
The PBoC’s reported gold purchases and gold’s share of total foreign exchange reserves*
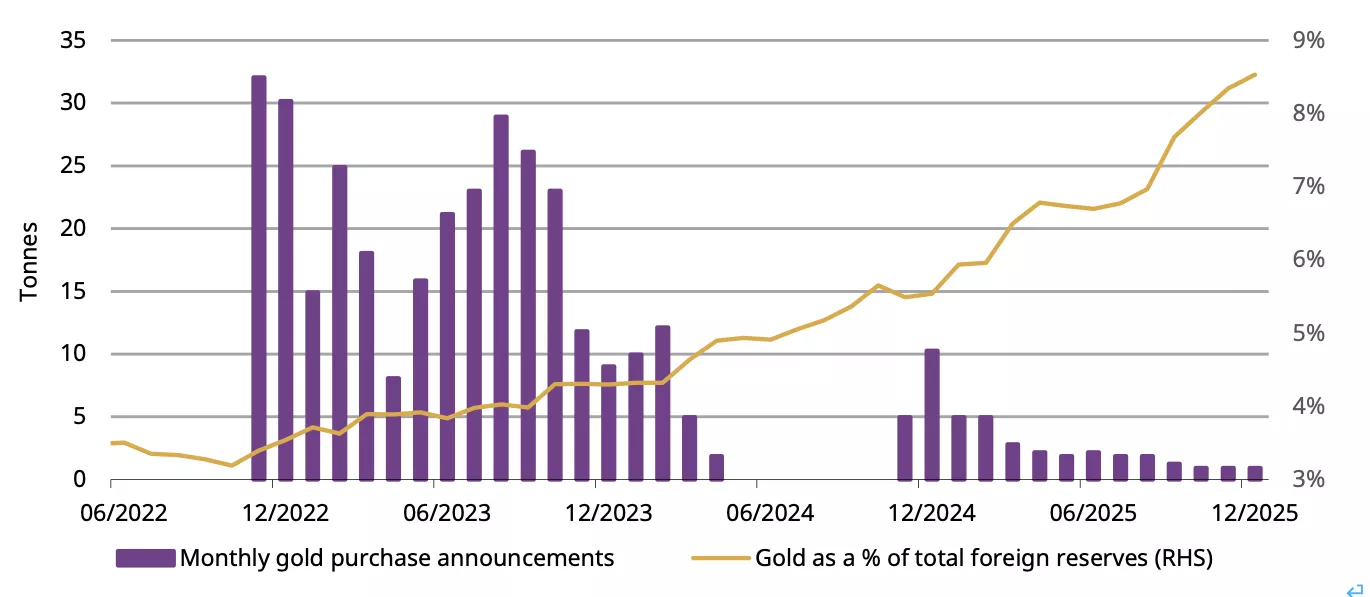
*Data to December 2025.
Source: State Administration of Foreign Exchanges, World Gold Council
Imports rebounded in November but the y/y weakness was notable
China’s net gold imports reached 47t in November, based on the latest data from China Customs: a 12t bounce m/m yet well below levels seen in previous years (-60t y/y) (Chart 8). More working days in the month may have contributed to the m/m improvement. But as we have noted previously, the recent VAT change dented China’s wholesale gold demand, leading to considerable monthly weakness compared to previous years. And the local gold price discount – amid weakening demand – further discouraged importers.
Chart 8: Gold imports saw a m/m rebound yet remained well below 2024 levels
Net 7108 gold imports under various regimes*
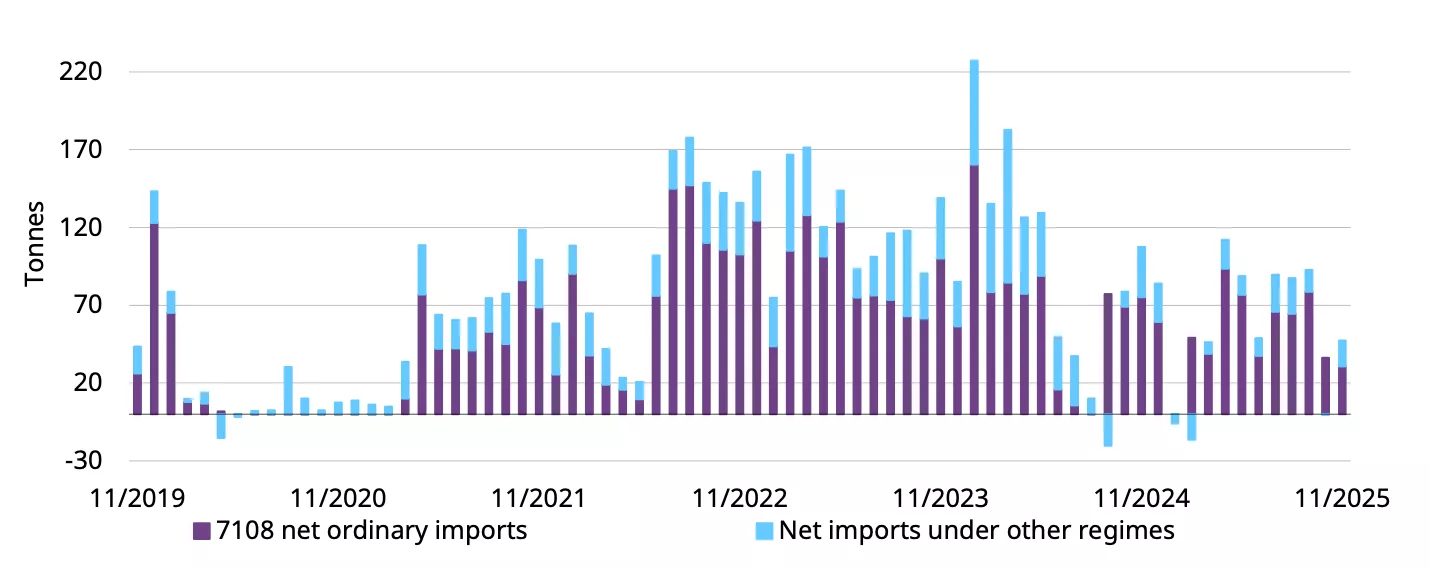
*Based on the latest data available. Data to November 2025.
Source: China Customs, World Gold Council
Footnotes
1Due to the fact that the SHAUPM only dates back to 2016, we refer to Au9999 price here.
Disclaimer
Important information and disclaimers
© 2026 World Gold Council. All rights reserved. World Gold Council and the Circle device are trademarks of the World Gold Council or its affiliates.
All references to LBMA Gold Price are used with the permission of ICE Benchmark Administration Limited and have been provided for informational purposes only. ICE Benchmark Administration Limited accepts no liability or responsibility for the accuracy of the prices or the underlying product to which the prices may be referenced. Other content is the intellectual property of the respective third party and all rights are reserved to them.
Reproduction or redistribution of any of this information is expressly prohibited without the prior written consent of World Gold Council or the appropriate copyright owners, except as specifically provided below. Information and statistics are copyright © and/or other intellectual property of the World Gold Council or its affiliates or third-party providers identified herein. All rights of the respective owners are reserved.
The use of the statistics in this information is permitted for the purposes of review and commentary (including media commentary) in line with fair industry practice, subject to the following two pre-conditions: (i) only limited extracts of data or analysis be used; and (ii) any and all use of these statistics is accompanied by a citation to World Gold Council and, where appropriate, to Metals Focus or other identified copyright owners as their source. World Gold Council is affiliated with Metals Focus.
The World Gold Council and its affiliates do not guarantee the accuracy or completeness of any information nor accept responsibility for any losses or damages arising directly or indirectly from the use of this information.
This information is for educational purposes only and by receiving this information, you agree with its intended purpose. Nothing contained herein is intended to constitute a recommendation, investment advice, or offer for the purchase or sale of gold, any gold-related products or services or any other products, services, securities or financial instruments (collectively, “Services”). This information does not take into account any investment objectives, financial situation or particular needs of any particular person.
Diversification does not guarantee any investment returns and does not eliminate the risk of loss. Past performance is not necessarily indicative of future results. The resulting performance of any investment outcomes that can be generated through allocation to gold are hypothetical in nature, may not reflect actual investment results and are not guarantees of future results. The World Gold Council and its affiliates do not guarantee or warranty any calculations and models used in any hypothetical portfolios or any outcomes resulting from any such use. Investors should discuss their individual circumstances with their appropriate investment professionals before making any decision regarding any Services or investments.
This information may contain forward-looking statements, such as statements which use the words “believes”, “expects”, “may”, or “suggests”, or similar terminology, which are based on current expectations and are subject to change. Forward-looking statements involve a number of risks and uncertainties. There can be no assurance that any forward-looking statements will be achieved. World Gold Council and its affiliates assume no responsibility for updating any forward-looking statements.
Information regarding the LBMA Gold Price
The LBMA Gold Price is used by the World Gold Council with permission under license by ICE Benchmark Administration Limited and is subject to the restrictions set forth here (www.gold.org/terms-and-conditions).
Information regarding QaurumSM and the Gold Valuation Framework
Note that the resulting performance of various investment outcomes that can be generated through use of Qaurum, the Gold Valuation Framework and other information are hypothetical in nature, may not reflect actual investment results and are not guarantees of future results. Neither World Gold Council (including its affiliates) nor Oxford Economics provides any warranty or guarantee regarding the functionality of the tool, including without limitation any projections, estimates or calculations.
Information from ICRA Analytics Limited
All information obtained from ICRA Analytics Limited contained in this document is subject to the disclaimer set forth here (www.icraanalytics.com/terms-of-use/disclaimer).
