You asked, we answered: Is gold’s appeal fading on rising vol?
19 December, 2025
Highlights:
Volatility: While gold’s volatility rose in 2025, it did so from a low base and in line with other assets; gold’s vol seems to have normalized, remaining broadly in line with long-term averages.
Portfolio diversification: Despite this increase, adding gold to a diversified portfolio continues to help reduce overall risk, especially in an environment where correlation between bonds and equities has risen.
Yes, volatility rose in 2025…just like other growth assets and in line with historical averages
Amid tariff uncertainties, inflationary pressures and geoeconomic strife, there is no shortage of market, macro and geopolitical risks to feed market volatility. To get a sense of the turmoil navigated by investors this year compared to last, Chart 1 shows the realised volatility of gold, US stocks and US Treasuries. Volatility has increased in both equity and gold markets, on the back of a supercharged geopolitical and geoeconomic enviromnent, with a significant surge in equity volatility around the initial tariffs announcement earlier in 2025. US treasury volatility on the other hand has been on a declining trend. On the whole, all asset class volatilities remain broadly in line with their long-term averages.
Chart 1: Equity and gold volatility have increased in 2025…but gold’s vol is below average
1-year rolling weekly annualised volatility for US stocks, European stocks, US treasuries, silver and gold*
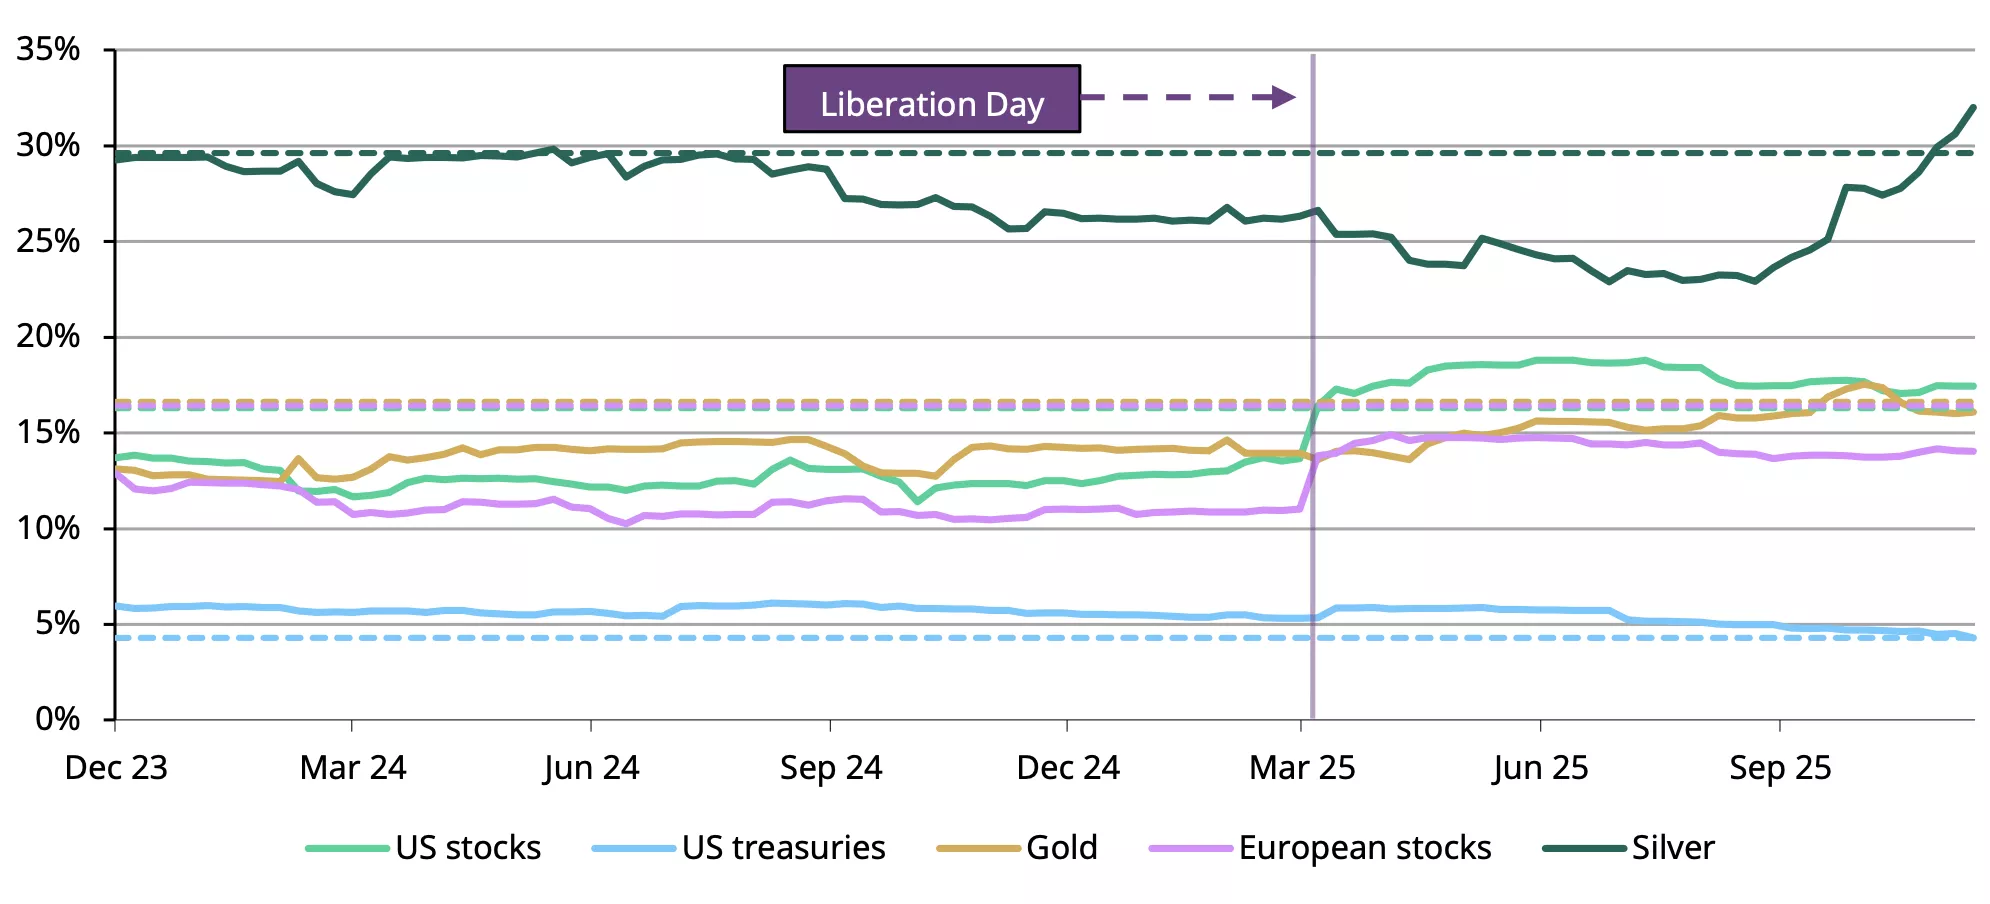
*Data as of 15 December 2025. Indices used: Bloomberg US Treasury Index, MSCI US Index, MSCI Europe Index, LBMA Silver Price, and LBMA Gold Price. Dashed lines represent the 20-year average volatility for the indices used.
Source: Bloomberg, World Gold Council
While gold’s volatility has risen alongside its strong price rally this year, it remains broadly in line with its long-term average and well below levels seen during previous periods of similar strong price performance (Chart 2). This suggests that, despite recent price strength, gold has moved in an orderly manner.
Chart 2: Despite the uptick in volatility in 2025, gold’s annualised volatility remains well below previous highs
Annualised gold volatility and returns*
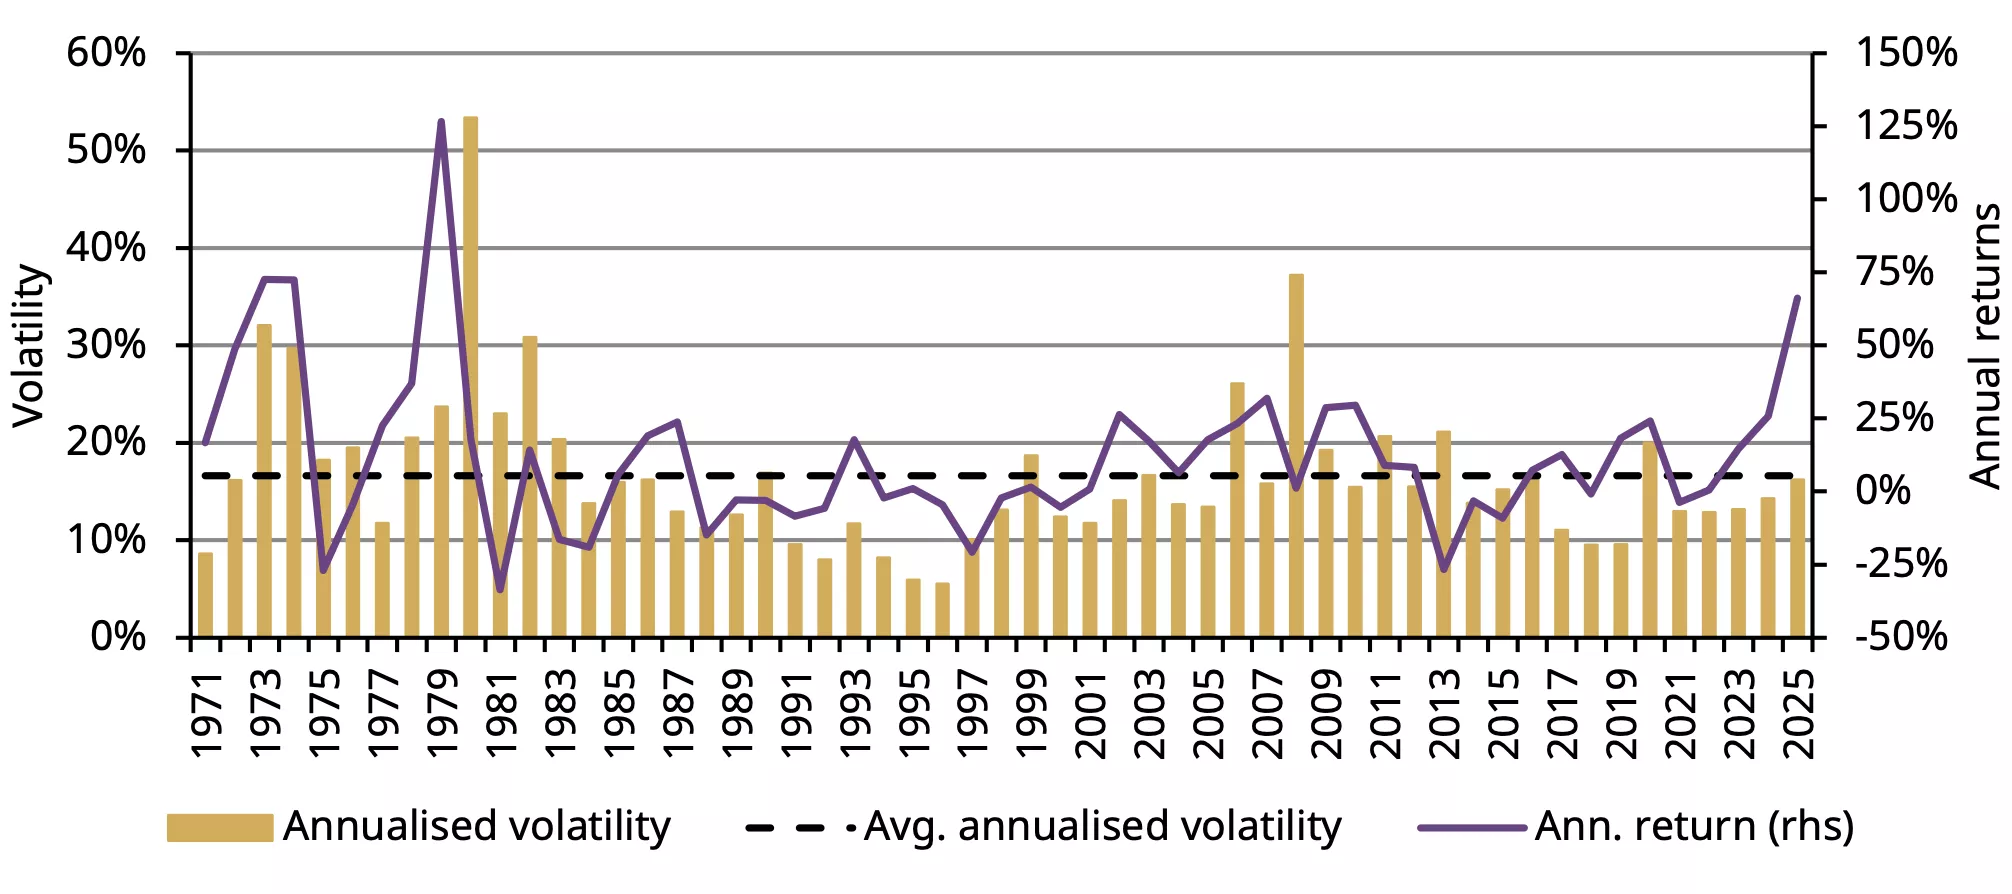
*Data from 1 January 1971 to 12 December 2025. Annualised volatility is calculated using weekly returns.
Source: Bloomberg, World Gold Council
What has this meant for portfolios?
The uptick in volatility across equities coupled with a positive correlation between stocks and bonds, has led to higher portfolio risk – a wake up call for investors to find alternative ways to manage portfolio volatility. This has become especially important now that we live in a world of diminishing diversfication benefits (Chart 3).
However, we know that gold has been an efficient source of portfolio diversification with it’s low correlation to equities and fixed income assets (Chart 4).
Chart 3: The benefits of diversification have moderated over time, but it’s better with gold…
Portfolio diversification benefit, rolling 36m*
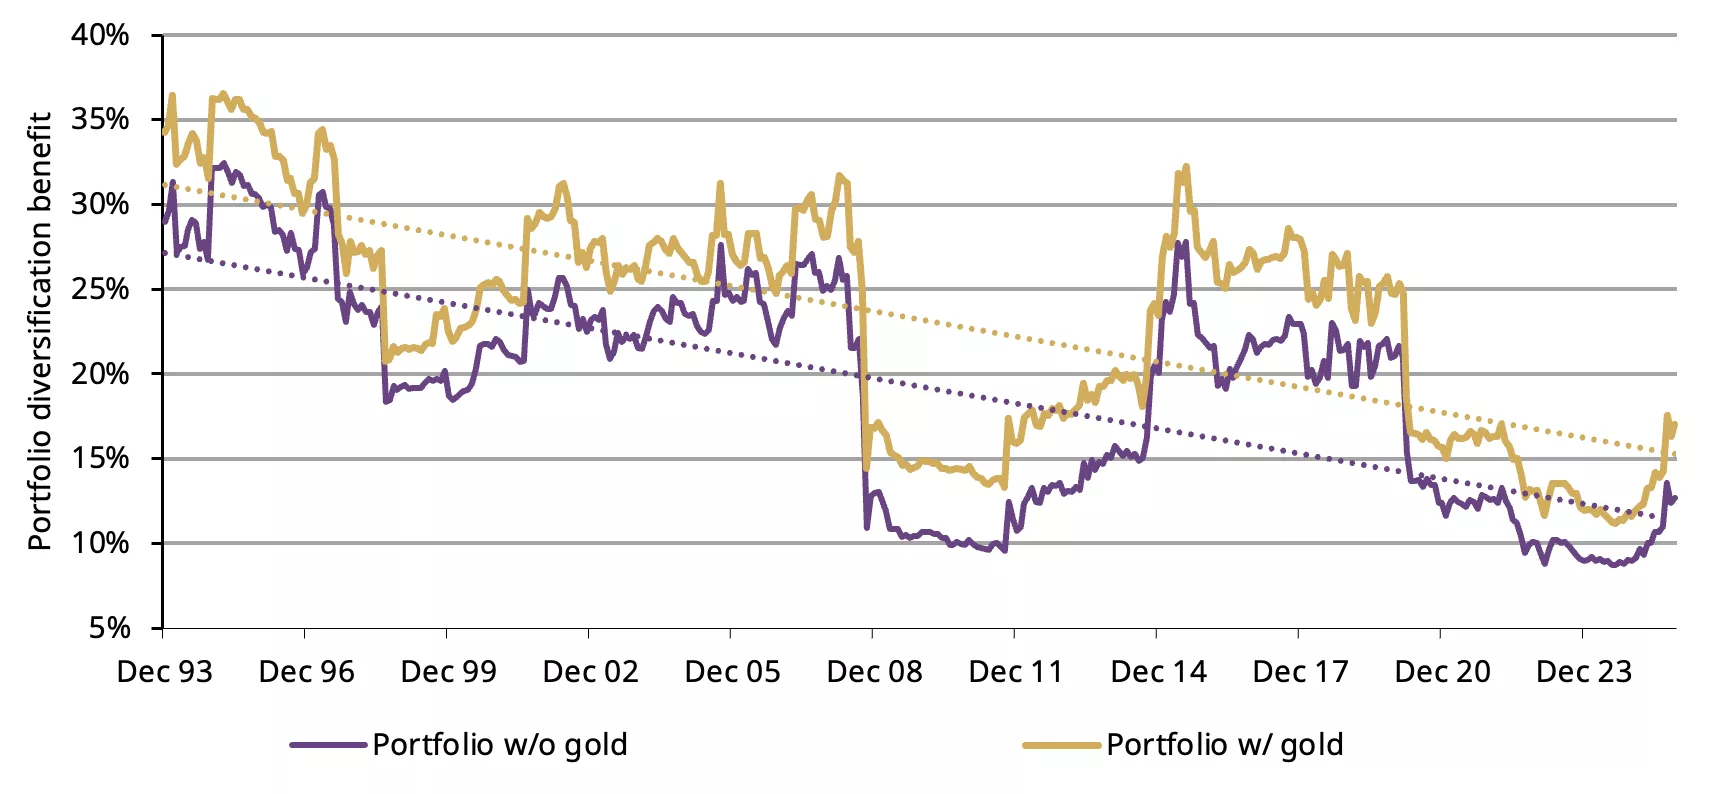
*Data from 31 December 1993 to 28 November 2025. Portfolio (without/with gold): US equities (35%/33.3%), EAFE equities (10%/9.5%), EM equities (10%/9.5%), US Aggregate bonds (30%/28.5%), US HY (5%/4.8%), REITS (10%/9.5%), Gold (0%/5%) rebalanced monthly. Diversification is calculated as %reduction in risk between weighted sum of asset volatilities and total portfolio volatility.
Source: Bloomberg, World Gold Council
Chart 4:…and has pushed investors to explore new uncorrelated assets like gold in their portfolios
Rolling 36m correlation*
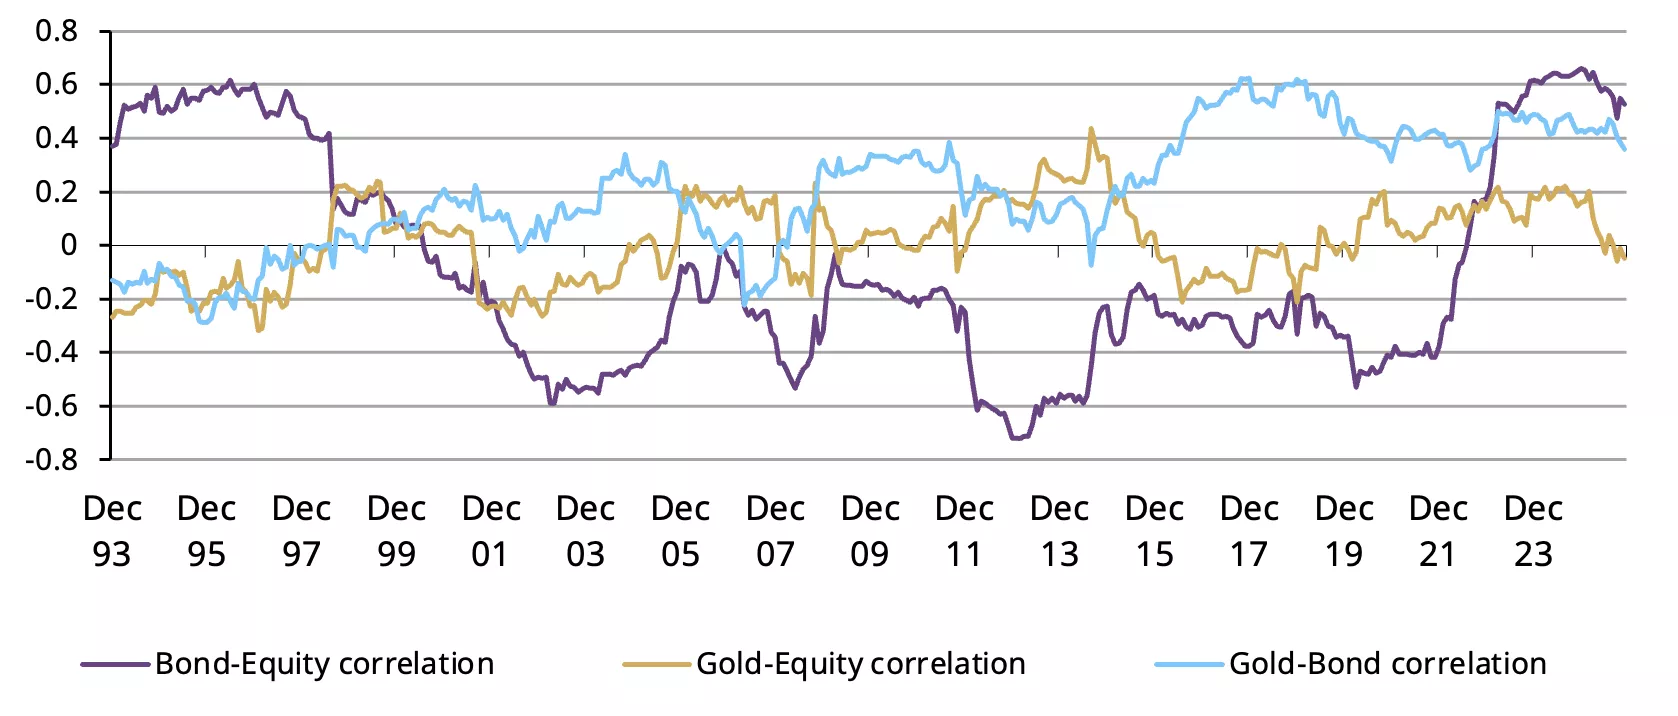
*Data from 31 December 1993 to 28 November 2025. Indices used: Bloomberg US Treasury Index, MSCI US Index and LBMA Gold Price
Source: Bloomberg, World Gold Council
Inflation and economic growth uncertainties affect stock-bond correlations differently: inflation shocks typically lead to positive bond-equity correlations due to its adverse effects on both asset classes; economic growth uncertainty on the other hand drives negative correlations as investors seek safety in bonds while stocks can suffer. We are currently in a low Growth vol/Inflation vol ratio environment, a signal of dominant inflation concerns.
Chart 5: Inflation is the dominant macro variable
Ratio of Growth/Inflation uncertainty and stock-bond correlation*
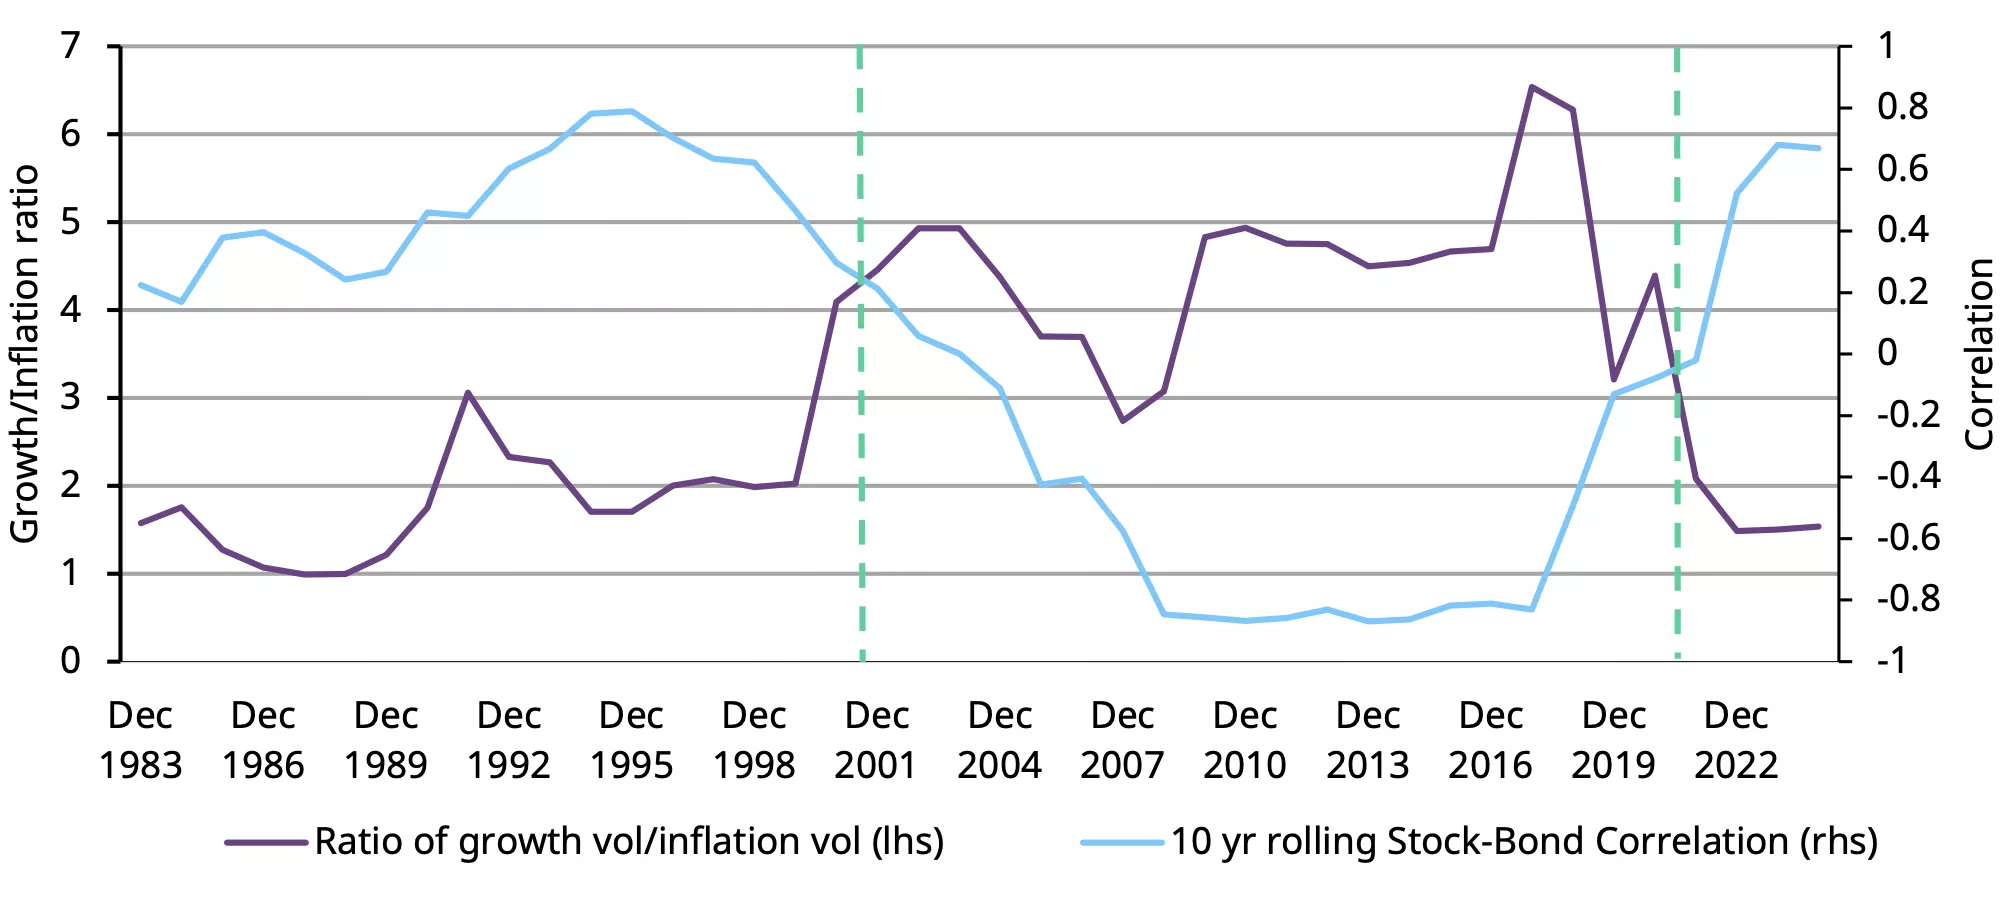
*Data 31 December 1973 to 30 September 2025. Growth/Inflation ratio was calculated using industrial production for growth volatility and US CPI for inflation volatility. Stock-bond correlation was calculated using S&P500 Index and Bloomberg US Treasury Index.
Source: Bloomberg, World Gold Council
In this current environment, adding gold to our hypothetical portfolio1 reduces the overall portfolio risk. In fact, adding 5% of gold reduces the portfolio risk by nearly 5% while its contribution to overall portfolio risk is negligible at 1.9% (Chart 6).
Chart 6: Portfolio risk has risen post 2022, but adding gold can reduce overall risk
Risk contribution and portfolio volatility during different regimes
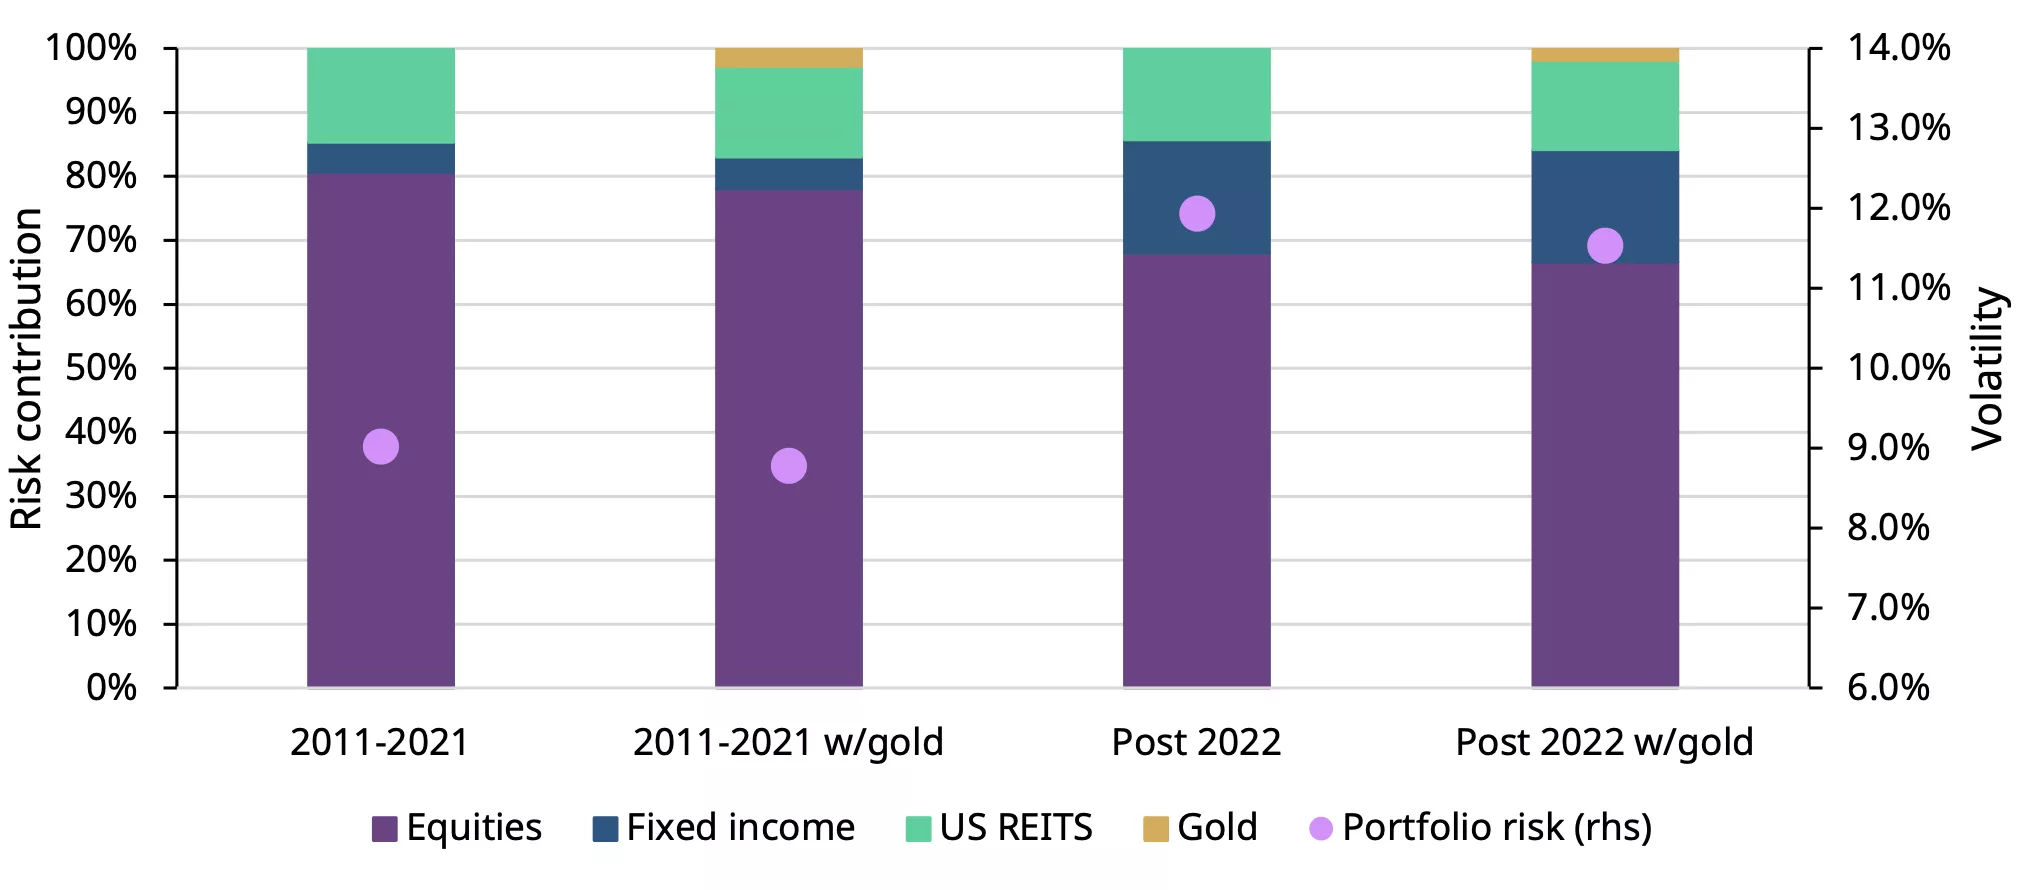
*Data from 31 December 2010 to 28 November 2025. Portfolio (without/with gold): US equities (35%/33.3%), EAFE equities (10%/9.5%), EM equities (10%/9.5%), US Aggregate bonds (30%/28.5%), US HY (5%/4.8%), REITS (10%/9.5%), Gold (0%/5%) rebalanced monthly. Risk contribution is calculated by multiplying each asset class weight by its weighted covariance with other assets, then dividing by the portfolio variance. Portfolio risk represents the volatility of the entire portfolio over the predefined periods shown on the chart.
Source: Bloomberg, World Gold Council
In summary
In a turbulent year marked by heightened macroeconomic and geopolitical risks, gold’s volatility has increased alongside that of other assets, including major equity indices. That said, its long-term behaviour has remained broadly consistent, and comparable to that of other growth assets.
While short-term surges in price and trading activity led to brief spikes in volatility, these episodes quickly normalised, underscoring gold’s resilience as a strategic asset.
Against a backdrop where traditional diversification benefits are waning, gold continues to play a valuable role in reducing overall portfolio risk, reinforcing its importance for investors seeking stability amid uncertainty.
Footnotes
1The hypothetical portfolio shown in Chart 6 represents just one combination of assets; other combinations may produce different results.
Disclaimer
Important information and disclaimers
© 2025 World Gold Council. All rights reserved. World Gold Council and the Circle device are trademarks of the World Gold Council or its affiliates.
All references to LBMA Gold Price are used with the permission of ICE Benchmark Administration Limited and have been provided for informational purposes only. ICE Benchmark Administration Limited accepts no liability or responsibility for the accuracy of the prices or the underlying product to which the prices may be referenced. Other content is the intellectual property of the respective third party and all rights are reserved to them.
Reproduction or redistribution of any of this information is expressly prohibited without the prior written consent of World Gold Council or the appropriate copyright owners, except as specifically provided below. Information and statistics are copyright © and/or other intellectual property of the World Gold Council or its affiliates or third-party providers identified herein. All rights of the respective owners are reserved.
The use of the statistics in this information is permitted for the purposes of review and commentary (including media commentary) in line with fair industry practice, subject to the following two pre-conditions: (i) only limited extracts of data or analysis be used; and (ii) any and all use of these statistics is accompanied by a citation to World Gold Council and, where appropriate, to Metals Focus or other identified copyright owners as their source. World Gold Council is affiliated with Metals Focus.
The World Gold Council and its affiliates do not guarantee the accuracy or completeness of any information nor accept responsibility for any losses or damages arising directly or indirectly from the use of this information.
This information is for educational purposes only and by receiving this information, you agree with its intended purpose. Nothing contained herein is intended to constitute a recommendation, investment advice, or offer for the purchase or sale of gold, any gold-related products or services or any other products, services, securities or financial instruments (collectively, “Services”). This information does not take into account any investment objectives, financial situation or particular needs of any particular person.
Diversification does not guarantee any investment returns and does not eliminate the risk of loss. Past performance is not necessarily indicative of future results. The resulting performance of any investment outcomes that can be generated through allocation to gold are hypothetical in nature, may not reflect actual investment results and are not guarantees of future results. The World Gold Council and its affiliates do not guarantee or warranty any calculations and models used in any hypothetical portfolios or any outcomes resulting from any such use. Investors should discuss their individual circumstances with their appropriate investment professionals before making any decision regarding any Services or investments.
This information may contain forward-looking statements, such as statements which use the words “believes”, “expects”, “may”, or “suggests”, or similar terminology, which are based on current expectations and are subject to change. Forward-looking statements involve a number of risks and uncertainties. There can be no assurance that any forward-looking statements will be achieved. World Gold Council and its affiliates assume no responsibility for updating any forward-looking statements.
Information regarding QaurumSM and the Gold Valuation Framework
Note that the resulting performance of various investment outcomes that can be generated through use of Qaurum, the Gold Valuation Framework and other information are hypothetical in nature, may not reflect actual investment results and are not guarantees of future results. Neither World Gold Council (including its affiliates) nor Oxford Economics provides any warranty or guarantee regarding the functionality of the tool, including without limitation any projections, estimates or calculations.
