Gold hits US$4,000/oz - trend or turning point?
13 October, 2025
Highlights
- A new milestone: Gold reached its 45th new all-time high of 2025 as it hit US$4,000/oz on 8 October – the move from US$3,500/oz to US$4,000/oz took just 36 days
- Drivers: The surge has been fuelled by strong investment demand amid geopolitical tensions, dollar weakness, US Fed cut expectations, and equity and bond market risks
- Early innings: Physically backed gold ETFs have added 634t y-t-d, with holdings just 2% below their 2020 peak, but the current accumulation phase looks nascent compared to previous historical periods
- Allocations: gold ownership does not appear saturated, but the rapid price increase may raise near-term risks.
Gold opens its US$4,000/oz chapter
Gold reached another historic milestone on 8 October 2025 as it broke through US$4,000/oz. And while it finished the week below the record high, it’s en route to mark its strongest performance in a calendar year since 1979 (Chart 1).
The comparison to gold’s move in the late 70’s has generated a lot of buzz as investors assess whether this most recent leg up is signalling a continuation of the trend or the start of a reversal.
Indeed, gold has been gaining ground fast. But it’s important to put things into perspective.
As we noted when gold surpassed US$3,000/oz, round-number milestones carry more psychological and technical weight than fundamental meaning. And it’s not just gold’s performance in a single year, but the length and underlying drivers of a bull run that should be the centre of attention. For example, gold’s recent run remains below the average duration and magnitude of previous bull runs (Chart 2).
Chart 1: Gold’s performance in 2025 has been compared to 1979 from an annual perspective… but gold price rallies have varied in duration and magnitude driven by the underlying macro environment
Annual gold return in nominal terms*
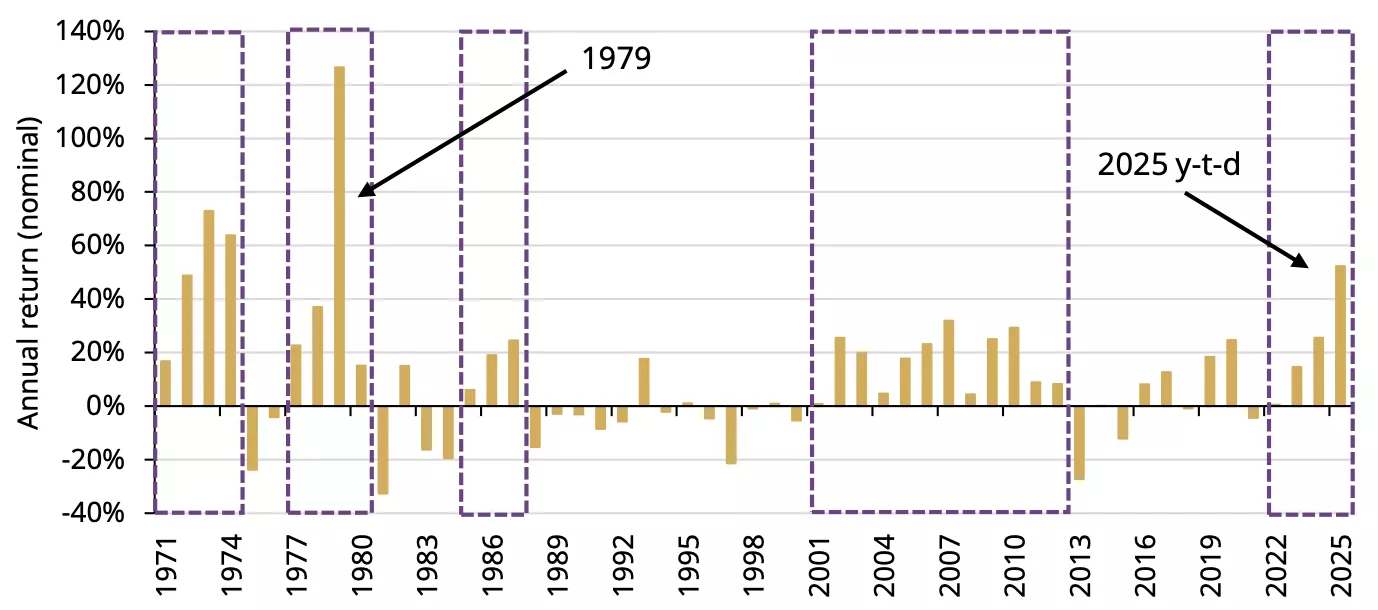
*Data as of 9 October 2025. Based on the LBMA Gold Price PM.
Source: Bloomberg, World Gold Council
Chart 2: Gold is only 735 days into this rally – previous major rallies have lasted on average 1,062 days
Percentage return from trough to peak during gold price rallies*
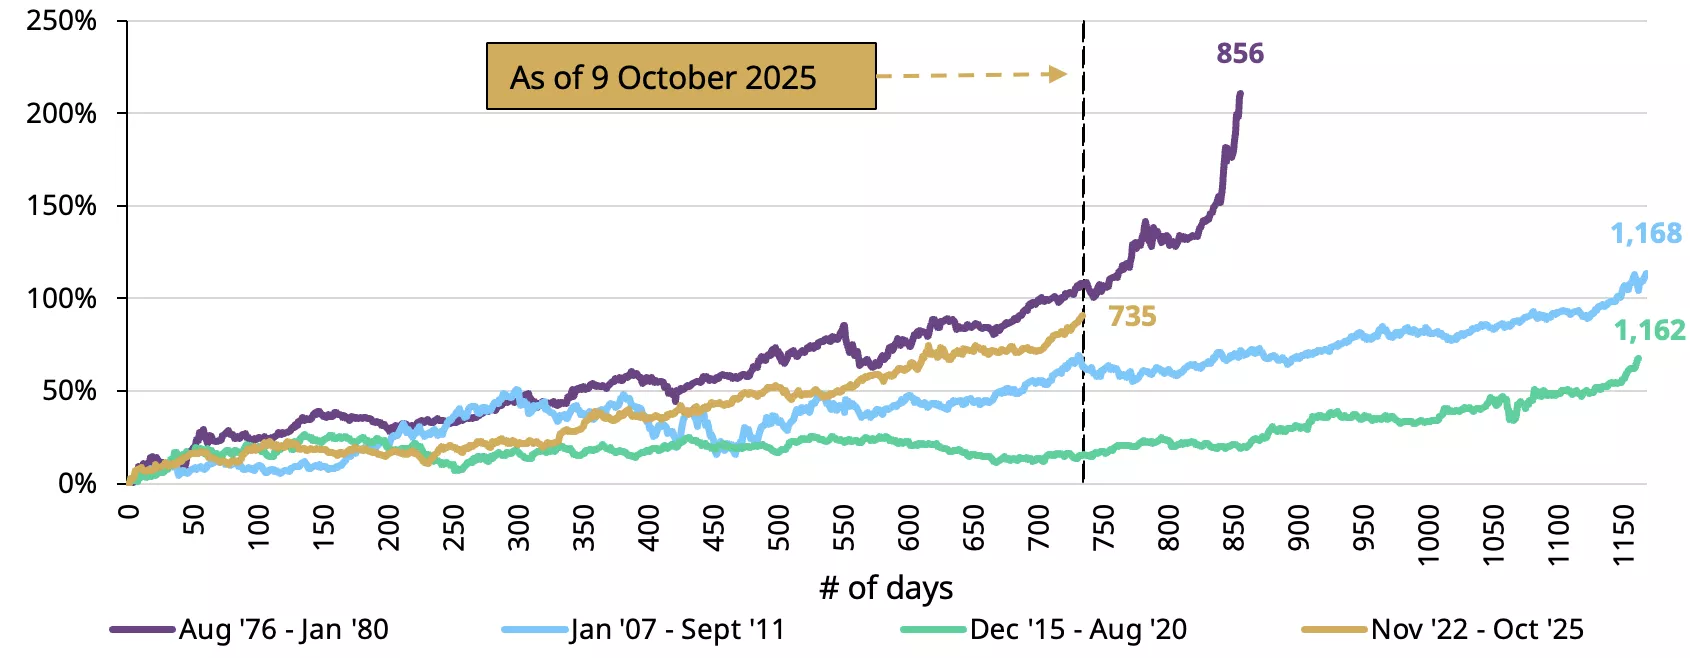
*Data as of 9 October 2025. Based on the LBMA Gold Price PM.
Source: Bloomberg, World Gold Council
What is driving gold's move?
Our analysis suggests that this year’s rally has been fuelled by increased investment demand, led by the West, as investors worldwide seek safe haven amid geopolitical tensions, dollar weakness, expectations of further Fed cuts, and fears of an equity market correction. Continued central bank buying has helped too, both in driving offtake but also cementing the positive narrative.
The pace at which the gold price has increased is notable, given gold climbed from US$3,500/oz to US$4,000/oz in just 36 days, compared to an average of 1,036 days between prior US$500/oz incremental milestones (Table 3). Yet this latest move was just 14% in relative terms, equating to an average of 50bps per day, a similar figure to the 2011 run up.
Rising prices have undoubtedly led to increased investor interest, further accelerating momentum. This is notable in gold ETF flows, which added US$21bn since the end of August to bring the y-t-d total to US$67bn.1
That leaves many asking: how much room is left to run?
While flows have been strong and assets under management keep climbing, holdings remain below previous highs. Gold ETFs have added 638t this year, bringing total holdings to 3,857t – 2% below their November 2020 peak of 3,929t. In addition, gold ETFs only added 128t in the last US$500/oz increase. And COMEX net longs are also below levels seen in prior all-time highs (Table 1).
Table 1: Growth in gold ETFs and futures net longs remain in line with prior US$500/oz tranche increases
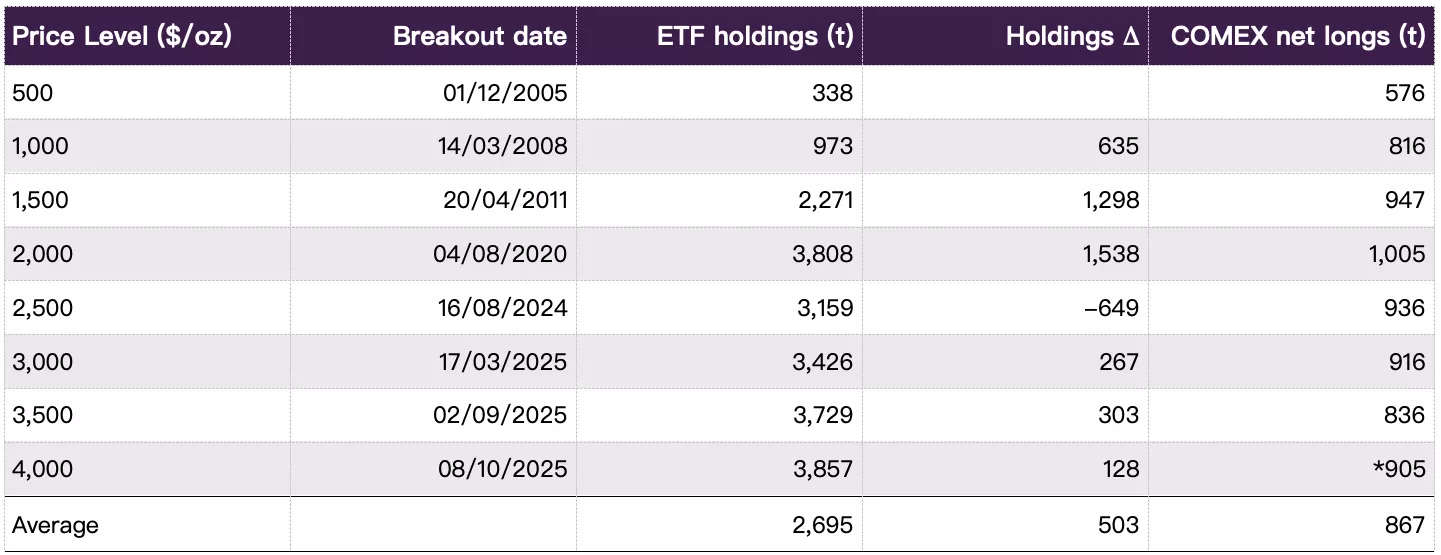
*Global gold ETF holdings as of 8 October 2025, and COMEX net longs (non-commercial and non reportable combined positions) data is as of 23 September 2025.
Source: Bloomberg, Company Filings, CFTC, World Gold Council
Further, there have been two prolonged gold ETF ‘bull runs’ since their appearance in 2003, lasting 221 and 253 weeks and adding 1,823t and 2,341t, respectively (Chart 3).
The most recent run for gold ETFs began in May 2024: 74 weeks in, holdings are up 788t and net longs have increased by just 116t. Compared to the averages of prior runs, this represents only 30%–40% of the total.
Chart 3: We are likely in the early innings of the next accumulation phase
Global gold ETF holdings and Δ of COMEX net longs in tonnes over prior “Bull” and “Bear” periods*
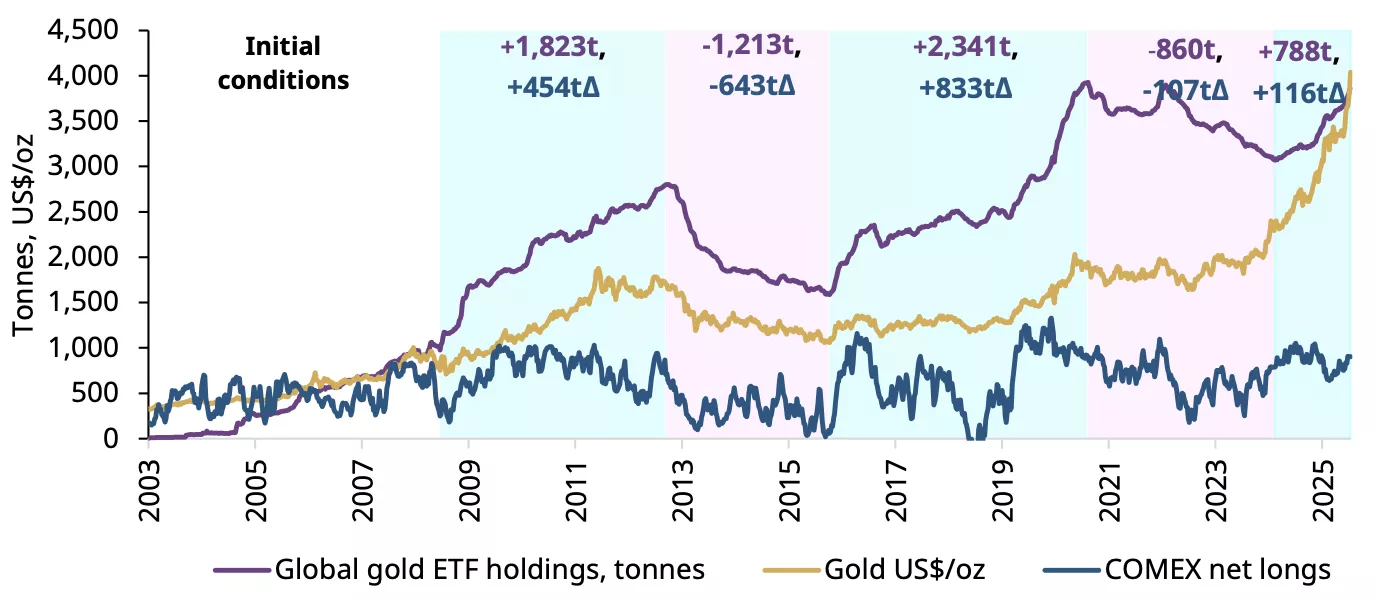
*Global ETF holdings as of 8 October 2025, and COMEX net longs (Non-Commercial + Non-Reportable combined positions) data as of 23 September 2025. The ‘+/-’ tonnage (bolded in purple) in each shaded region represents the amount of tonnage added or removed from the physical holdings of global gold-backed ETFs. The ‘Δ’ in tonnage (bolded in blue) in each shaded region shows the change in COMEX net longs from the start to the end of each period.
Source: Bloomberg, World Gold Council
What we are looking out for next…
As gold tests whether US$4,000/oz is a key level of support or resistance, it could face several tactical challenges. Short-term dynamics could introduce volatility and potential profit taking. For example:
- Gold allocations nearing targets may prompt portfolio rebalancing by strategic investors
- Technical indicators for gold – RSI above 90 and prices more than 20% above their 200-day average – suggest an overbought market which may lead short-term investors to position for a reversal
- Tighter credit conditions could trigger liquidation of high-performing assets like gold as investor search for cash
- A sharp dollar short squeeze remains a threat despite recent investor resilience
- The rapid gold price increase will likely dampen consumer demand during an otherwise strong seasonal period
- A resolution of geoeconomic risks could shift capital to risk on assets.
However, despite short-term volatility, gold’s strategic foundation remains robust. A diverse investor base, macroeconomic shifts, and policy uncertainty continue to support long-term demand. Supportive factors include:
- A broader investor base: growth in low-cost ETFs, 1oz COMEX futures, and regulatory shifts in China and India opening the door to institutional strategic allocations
- Secular US dollar weakness encourages foreign hedging and potential rotation out of US assets
- Persistent US policy uncertainty and rising geopolitical tensions2
- Inflation and labour market weakness could increase the risk of a recession.
In summary
Gold marked a new milestone as it reached US$4,000/oz. Its future path will depend on how investors respond to tactical and fundamental factors. In our view, comparisons to 1979 are enticing but misleading.
There are reasons to believe that gold’s run has not run out of steam, especially in the broader macroeconomic context. For example: high real rates that are likely coming down, tight credit spreads that can widen, lofty stock markets that can easily correct, among others (Table 2).
Short-term volatility may arise from portfolio rebalancing, market corrections, and technical signals, while long-term resilience is underpinned by a broadening investor base, persistent policy uncertainty and a gold investment market that still has room to grow.
In our view, gold’s strategic strengths continue to balance the tactical risks as this new stage unfolds.
Table 2: US gold investor scorecard*
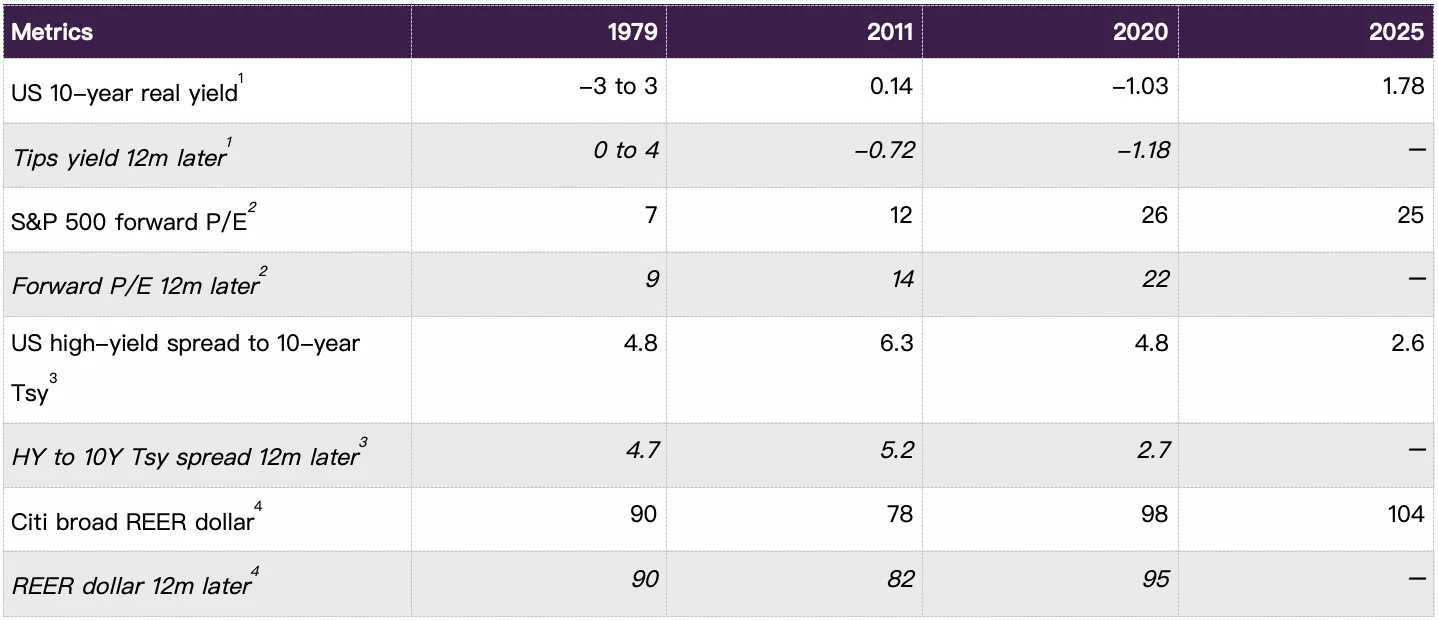
*Data as of 9 October 2025.
1) First figure is US 10-year yield less CPI inflation, second figure uses Survey of Professional Forecasters' 10-year median inflation expectations
2) Shiller Price to current EPS
3) Corporate Agg yield to worst + average HY / Corporate Agg spread since 1987
4) Broad US dollar REER (goods only)
Source: Bloomberg, World Gold Council
Appendix
Table 3: Historical gold price support and resistance level overview*
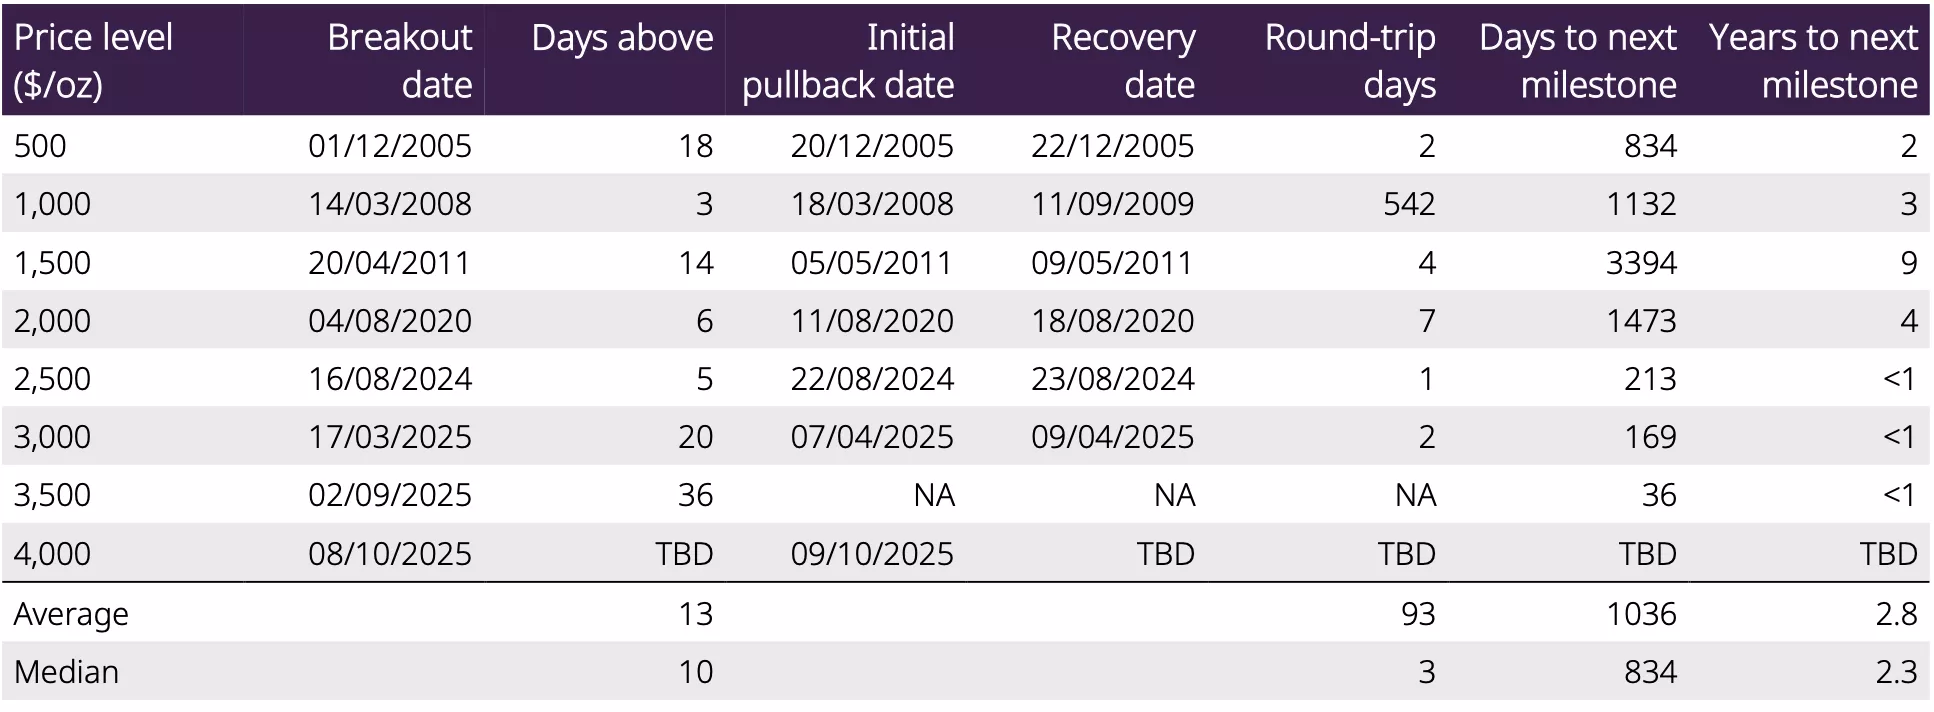
*Based on the LBMA Gold Price PM as of 08 October 2025. Breakout date defined as first day gold broke through resistance. Pullback date defined as first date that gold fell through support level (resistance level it just broke). Recovery date is the date on which gold round tripped back through its prior support/resistance level and stayed above that.
Source: Bloomberg, World Gold Council
Footnotes:
1As of 10 October 2025.
2Trump Sees ‘No Reason’ to Meet Xi, Threatens New Tariffs | Bloomberg | 10 October 2025
Disclaimer
Important information and disclaimers
© 2025 World Gold Council. All rights reserved. World Gold Council and the Circle device are trademarks of the World Gold Council or its affiliates.
All references to LBMA Gold Price are used with the permission of ICE Benchmark Administration Limited and have been provided for informational purposes only. ICE Benchmark Administration Limited accepts no liability or responsibility for the accuracy of the prices or the underlying product to which the prices may be referenced. Other content is the intellectual property of the respective third party and all rights are reserved to them.
Reproduction or redistribution of any of this information is expressly prohibited without the prior written consent of World Gold Council or the appropriate copyright owners, except as specifically provided below. Information and statistics are copyright © and/or other intellectual property of the World Gold Council or its affiliates or third-party providers identified herein. All rights of the respective owners are reserved.
The use of the statistics in this information is permitted for the purposes of review and commentary (including media commentary) in line with fair industry practice, subject to the following two pre-conditions: (i) only limited extracts of data or analysis be used; and (ii) any and all use of these statistics is accompanied by a citation to World Gold Council and, where appropriate, to Metals Focus or other identified copyright owners as their source. World Gold Council is affiliated with Metals Focus.
The World Gold Council and its affiliates do not guarantee the accuracy or completeness of any information nor accept responsibility for any losses or damages arising directly or indirectly from the use of this information.
This information is for educational purposes only and by receiving this information, you agree with its intended purpose. Nothing contained herein is intended to constitute a recommendation, investment advice, or offer for the purchase or sale of gold, any gold-related products or services or any other products, services, securities or financial instruments (collectively, “Services”). This information does not take into account any investment objectives, financial situation or particular needs of any particular person.
Diversification does not guarantee any investment returns and does not eliminate the risk of loss. Past performance is not necessarily indicative of future results. The resulting performance of any investment outcomes that can be generated through allocation to gold are hypothetical in nature, may not reflect actual investment results and are not guarantees of future results. The World Gold Council and its affiliates do not guarantee or warranty any calculations and models used in any hypothetical portfolios or any outcomes resulting from any such use. Investors should discuss their individual circumstances with their appropriate investment professionals before making any decision regarding any Services or investments.
This information may contain forward-looking statements, such as statements which use the words “believes”, “expects”, “may”, or “suggests”, or similar terminology, which are based on current expectations and are subject to change. Forward-looking statements involve a number of risks and uncertainties. There can be no assurance that any forward-looking statements will be achieved. World Gold Council and its affiliates assume no responsibility for updating any forward-looking statements.
Information regarding QaurumSM and the Gold Valuation Framework
Note that the resulting performance of various investment outcomes that can be generated through use of Qaurum, the Gold Valuation Framework and other information are hypothetical in nature, may not reflect actual investment results and are not guarantees of future results. Neither World Gold Council (including its affiliates) nor Oxford Economics provides any warranty or guarantee regarding the functionality of the tool, including without limitation any projections, estimates or calculations.
