China’s gold market in April: investment demand remained strong
15 May, 2024
Key highlights:
- The Shanghai Gold Benchmark PM (SHAUPM) in RMB and the LBMA Gold Price AM in USD extended momentum in April, both capturing further rises
- Gold withdrawals from the Shanghai Gold Exchange (SGE) totalled 131t in April, a 7t rise m/m and a 10t increase y/y: robust investment demand offset gold jewellery weakness
- The average local gold price premium matched trends in China’s wholesale gold demand, rising m/m
- Chinese gold ETFs saw their fifth consecutive monthly inflow in April, adding RMB9bn (+US$1.3bn, +17t), the largest ever; both holdings and total assets under management (AUM) refreshed record highs
- The People’s Bank of China (PBoC) has now announced gold purchases for 18 consecutive months. Total official gold holdings ended April 2t higher at 2,264t, accounting for 4.9% of PBoC total reserves, the highest ever.
Looking ahead
- Conversations with the industry reveal tepid gold jewellery consumption during the five-day Labour Day holiday in early May as an elevated gold price deterred consumers. Meanwhile, investment demand showed signs of slowing in late April and early May as gold price volatility pushed investors to the sidelines, apparently awaiting a clearer price trend
- Looking ahead, jewellery consumption may remain weak amid seasonality and the elevated gold price. But despite some signs of weakening , we believe the continuing need for value preservation and gold’s current high profile will likely support gold investment in China.
April saw continued gold price strength
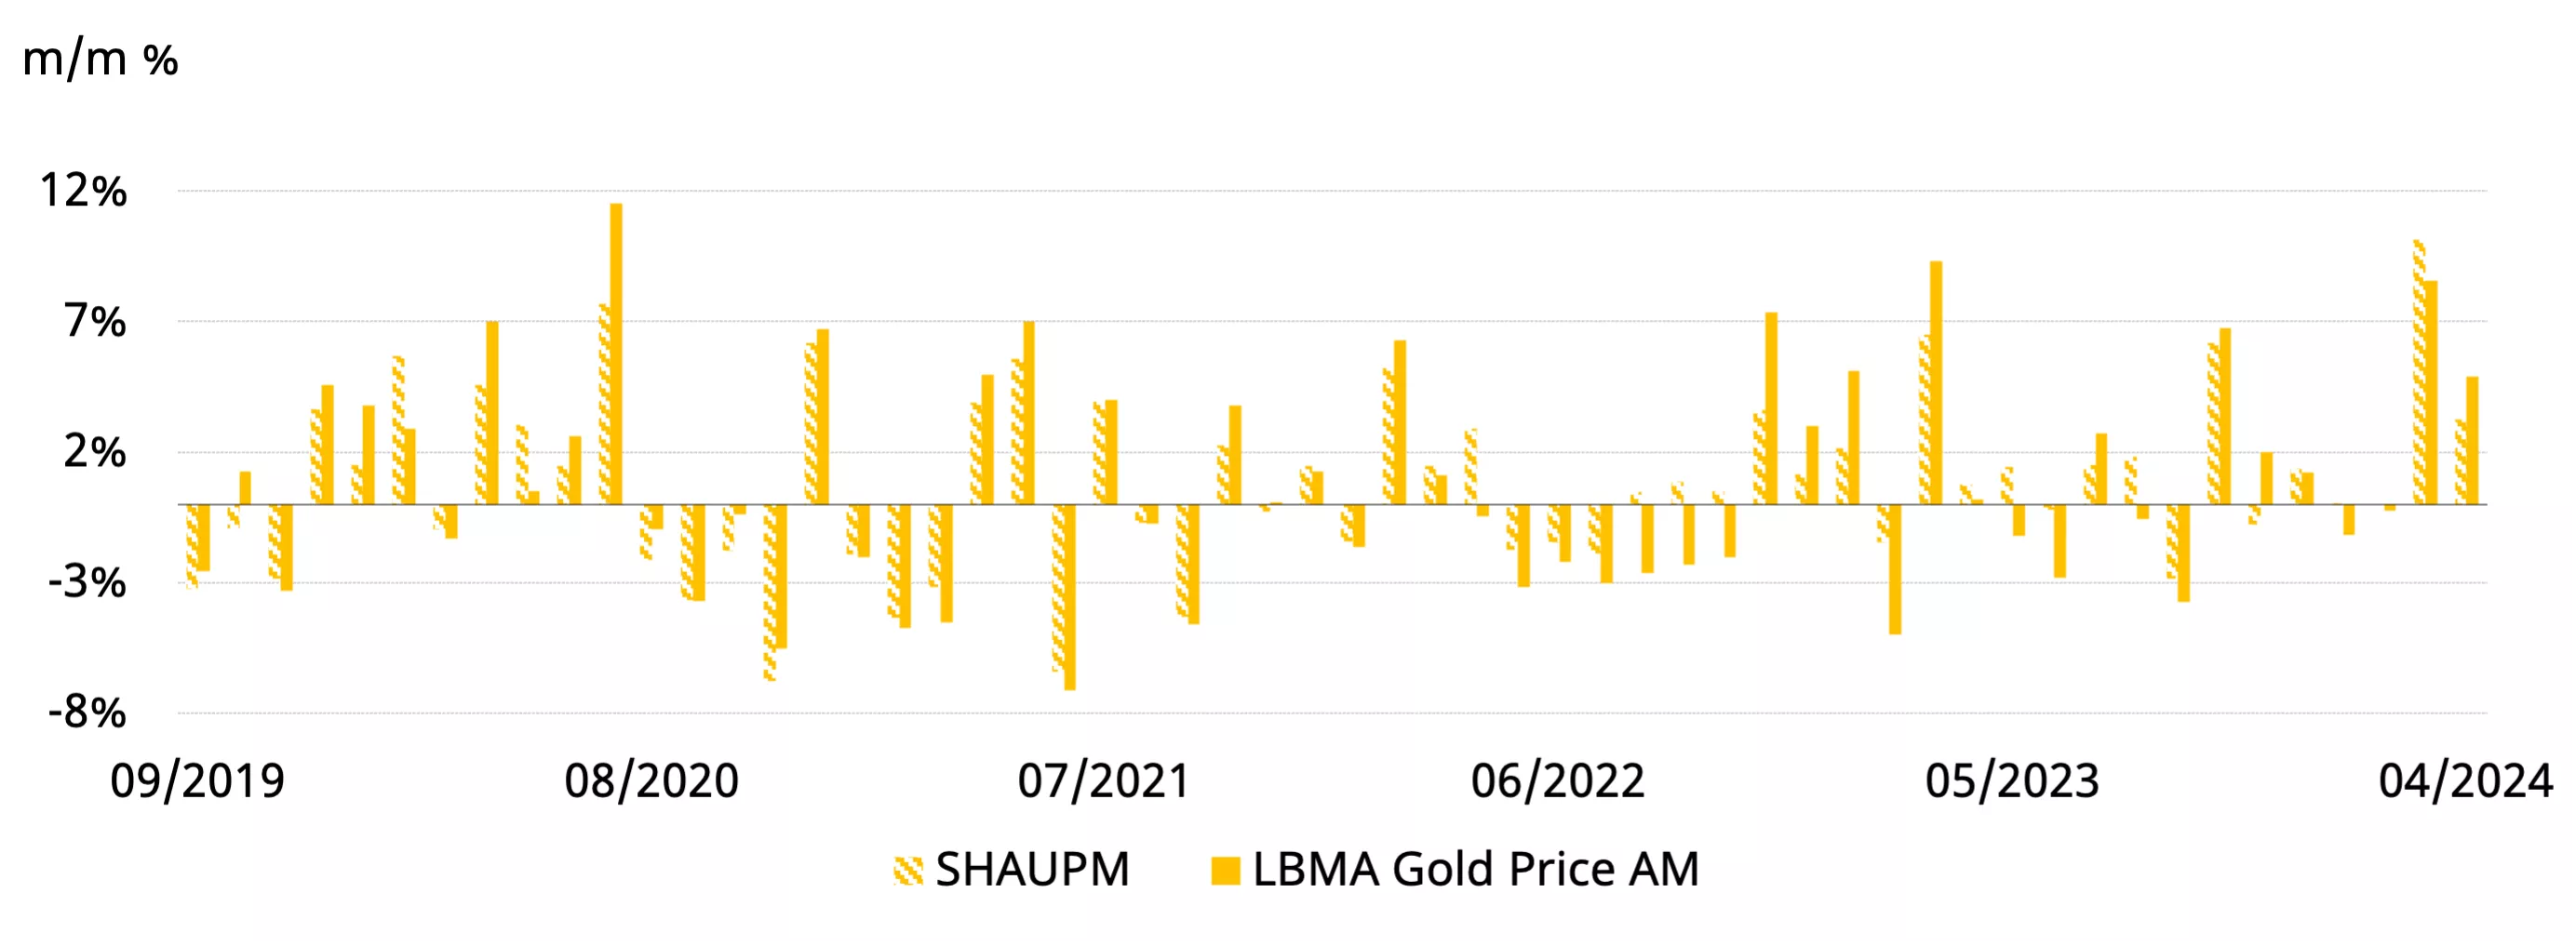
Gold prices rose again in April, albeit at a slower pace than March (Chart 1). The LBMA Gold Price AM in USD rose by 5% whilst the SHAUPM in RMB saw a smaller increase of 3%. Factors such as increased geopolitical risks and active futures trading contributed to gold’s strength in the month.
Chart 1: Gold rose further
Monthly changes of SHAUPM and LBMA Gold Price AM*
*Note: We compare the LBMA Gold Price AM to SHAUPM because the trading windows used to determine them are closer to each other than those for the LBMA Gold Price PM. For more information about Shanghai Gold Benchmark Prices please visit Shanghai Gold Exchange.
Source: Bloomberg, Shanghai Gold Exchange, World Gold Council
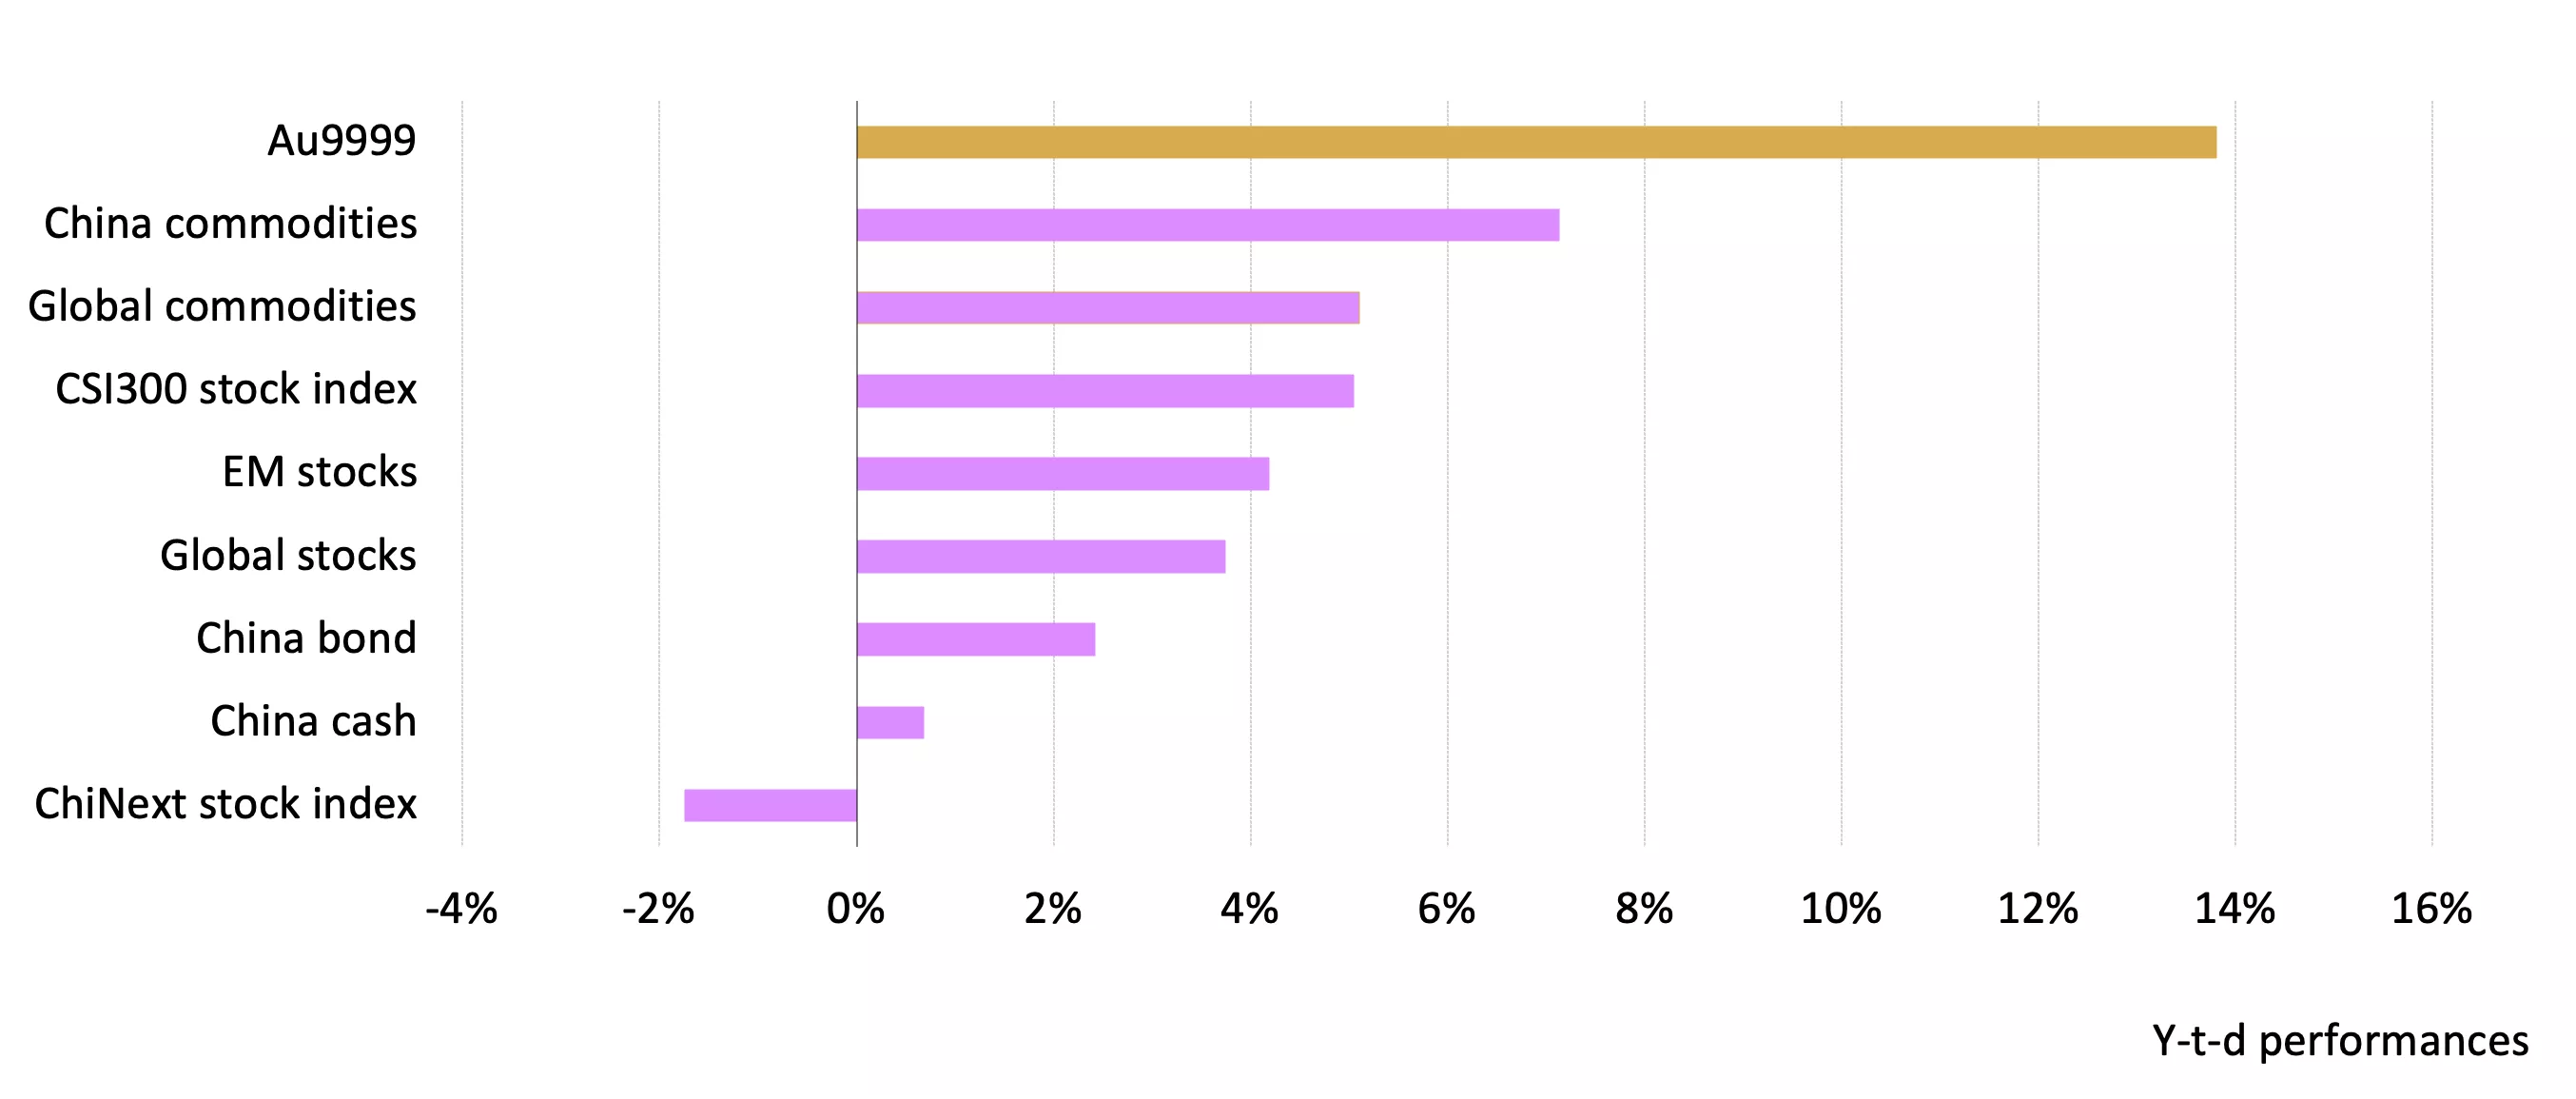
Compared to other major assets gold has done well so far this year (Chart 2). April extended the RMB gold price return to 14% y-t-d and drew continued attention from local investors.
Chart 2: Gold extended its y-t-d gain in April
Major asset performance so far in 2024*
*As of 30 April 2024; all calculations in RMB. Based on the SHAUPM, S&P500 Index, WTI Crude Oil, Bloomberg US Treasury Agg, CSI China Money Market Fund Index, Wind China Commodity Index, Bloomberg China Bond Aggregate, Shanghai Shenzhen 300 Stock Index, and the ChiNext stock index.
Source: Bloomberg, Shanghai Gold Exchange, World Gold Council
Wholesale gold demand climbed higher
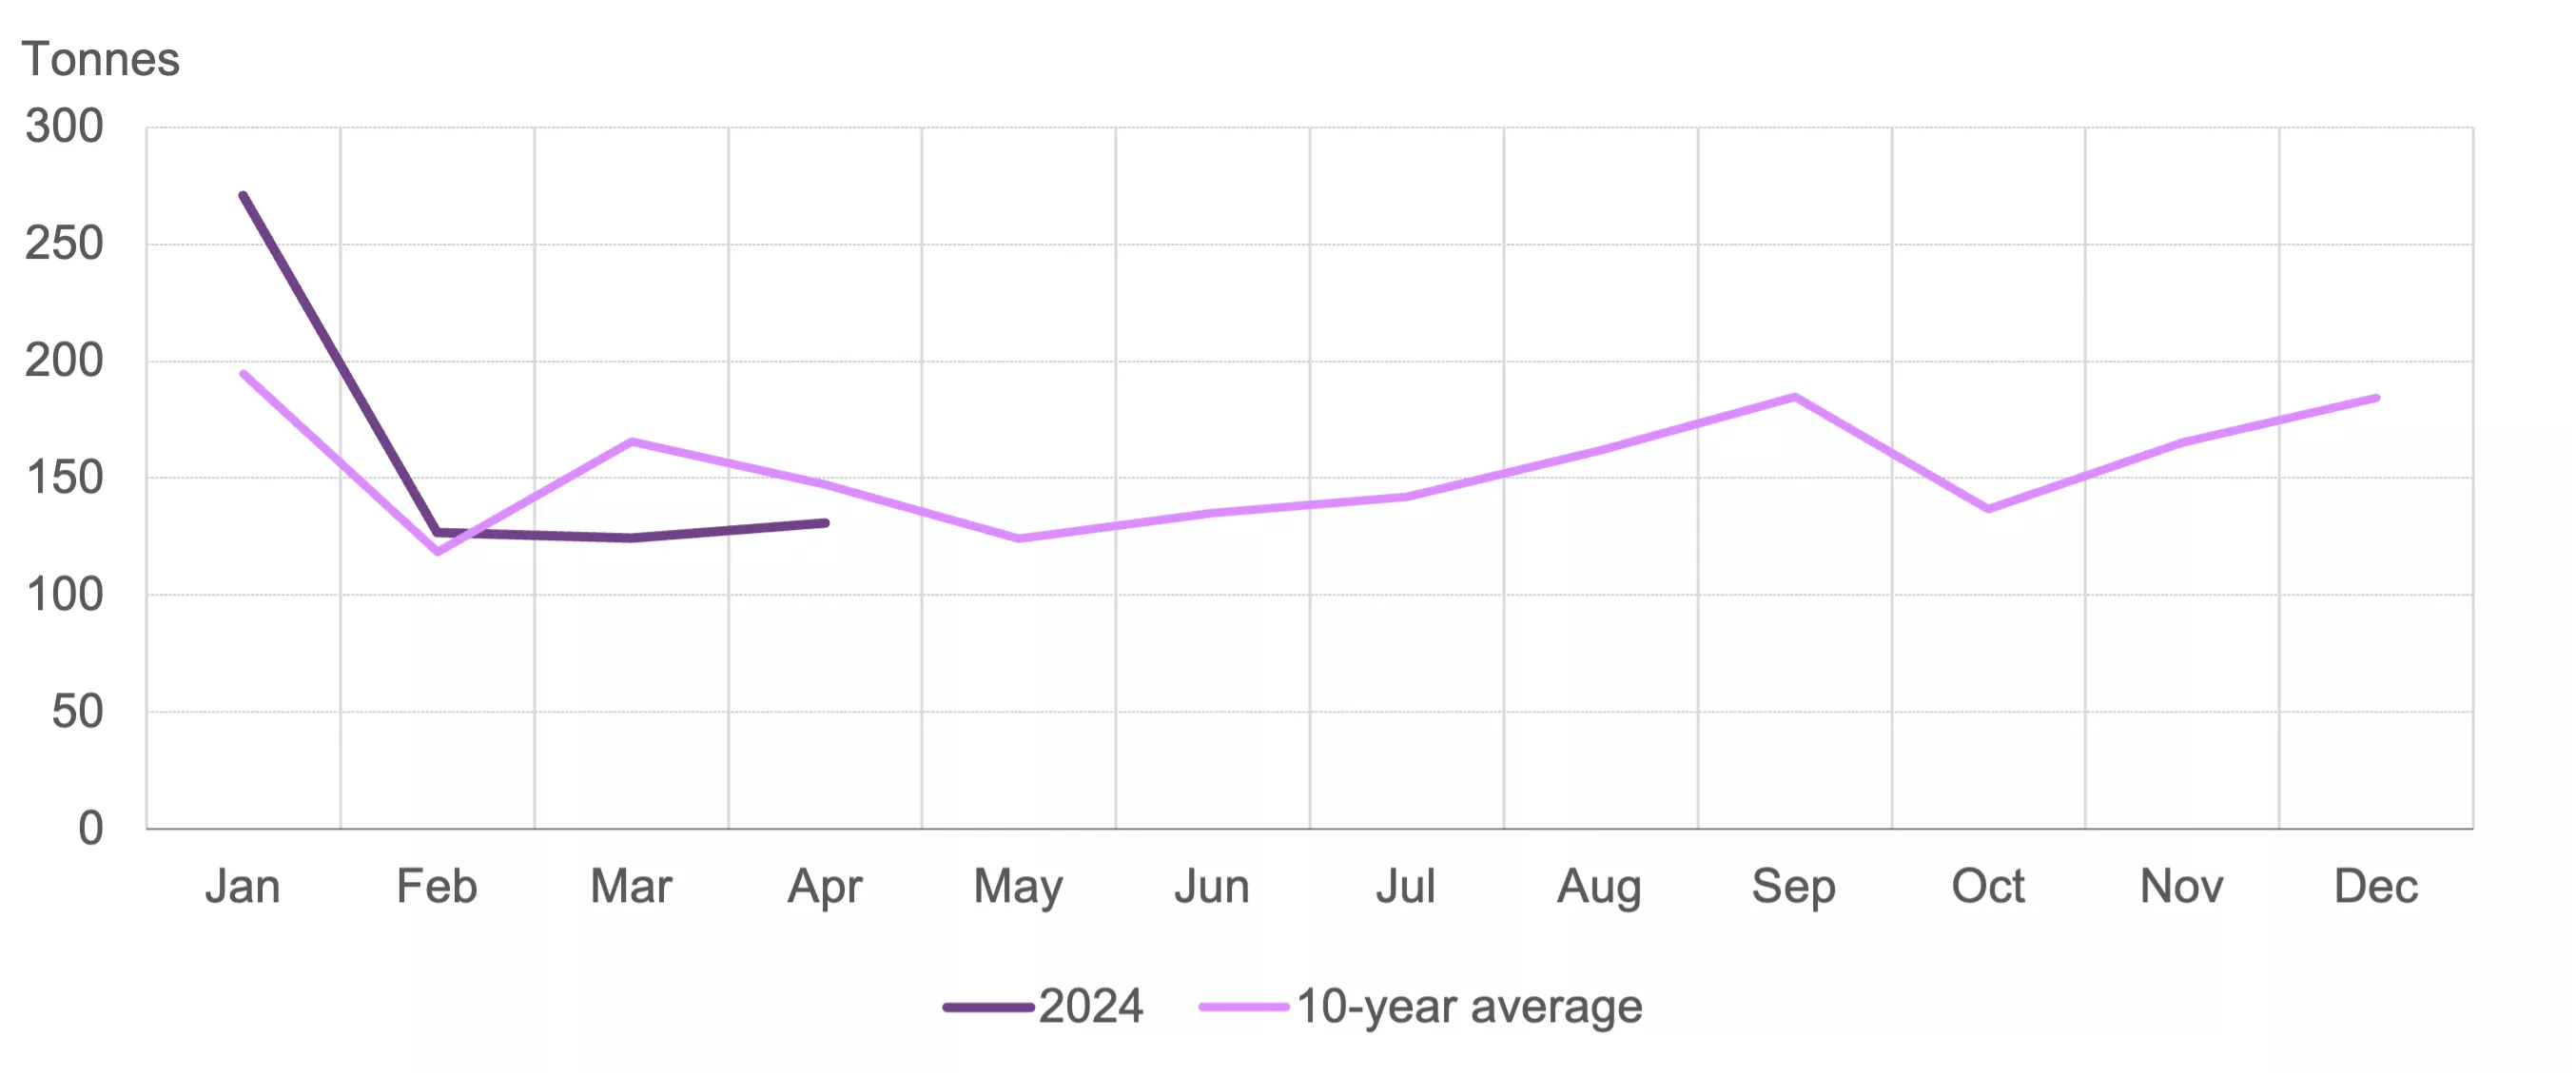
The industry withdrew 131t of gold from the SGE in April, 7t higher m/m and 10t higher y/y (Chart 3). In general, investment strength cancelled the weaknesses in gold jewellery demand. Anecdotal evidence suggests physical gold investment remained strong amid persistent value preservation needs and the rising gold price, especially during the first half of April. But the gold price strength made many jewellers cautious about re-stocking for the traditional Labour Day holiday sales boost.
Chart 3: Investment demand supported SGE gold withdrawals
Gold withdrawals from the SGE in 2024 and the 10-year average*
*10-year average based on data between 2014 and 2023.
Source: Shanghai Gold Exchange, World Gold Council
The local premium mirrored demand trends
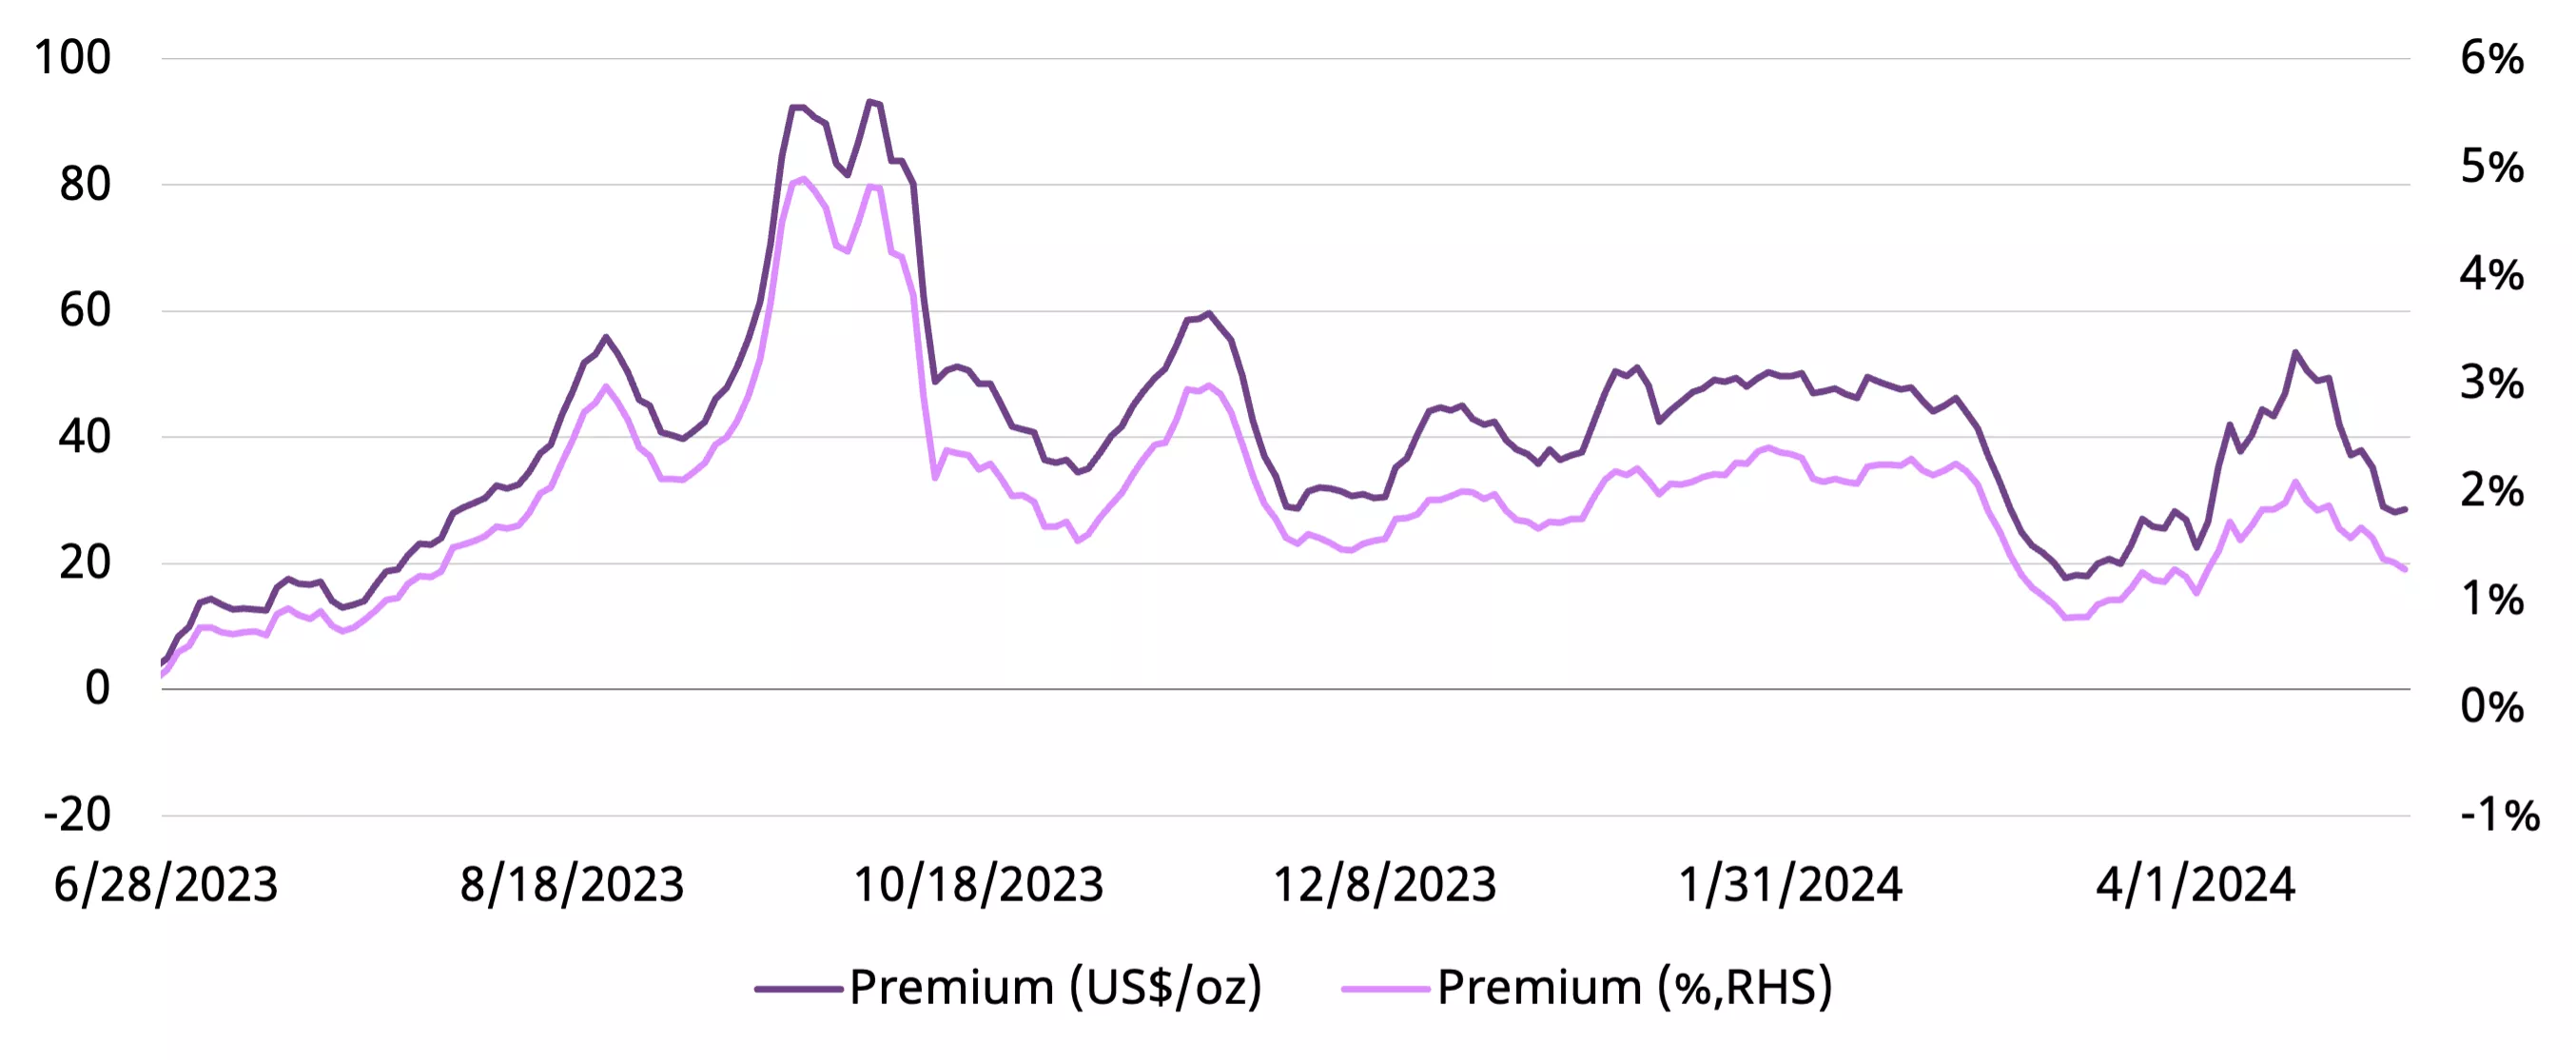
Changes in the local gold price premium revealed trends in demand. On a monthly average basis, April’s premium rose to US$42/oz (1.7%), up US$16/oz m/m. And a closer look reveals a pattern (Chart 4): while the continued price surge drove up investment demand during the first half of the month, the price pullback later appears to have cooled momentum.
Chart 4: The local gold price premium rose and fell in April
The monthly average spread between SHAUPM and LBMA Gold Price AM in US$/oz and %*
*Before April 2014 the spread calculation was based on Au9999 and LBMA Gold Price AM; click here for more.
Source: Bloomberg, Shanghai Gold Exchange, World Gold Council
Chinese gold ETFs recorded the strongest ever monthly demand
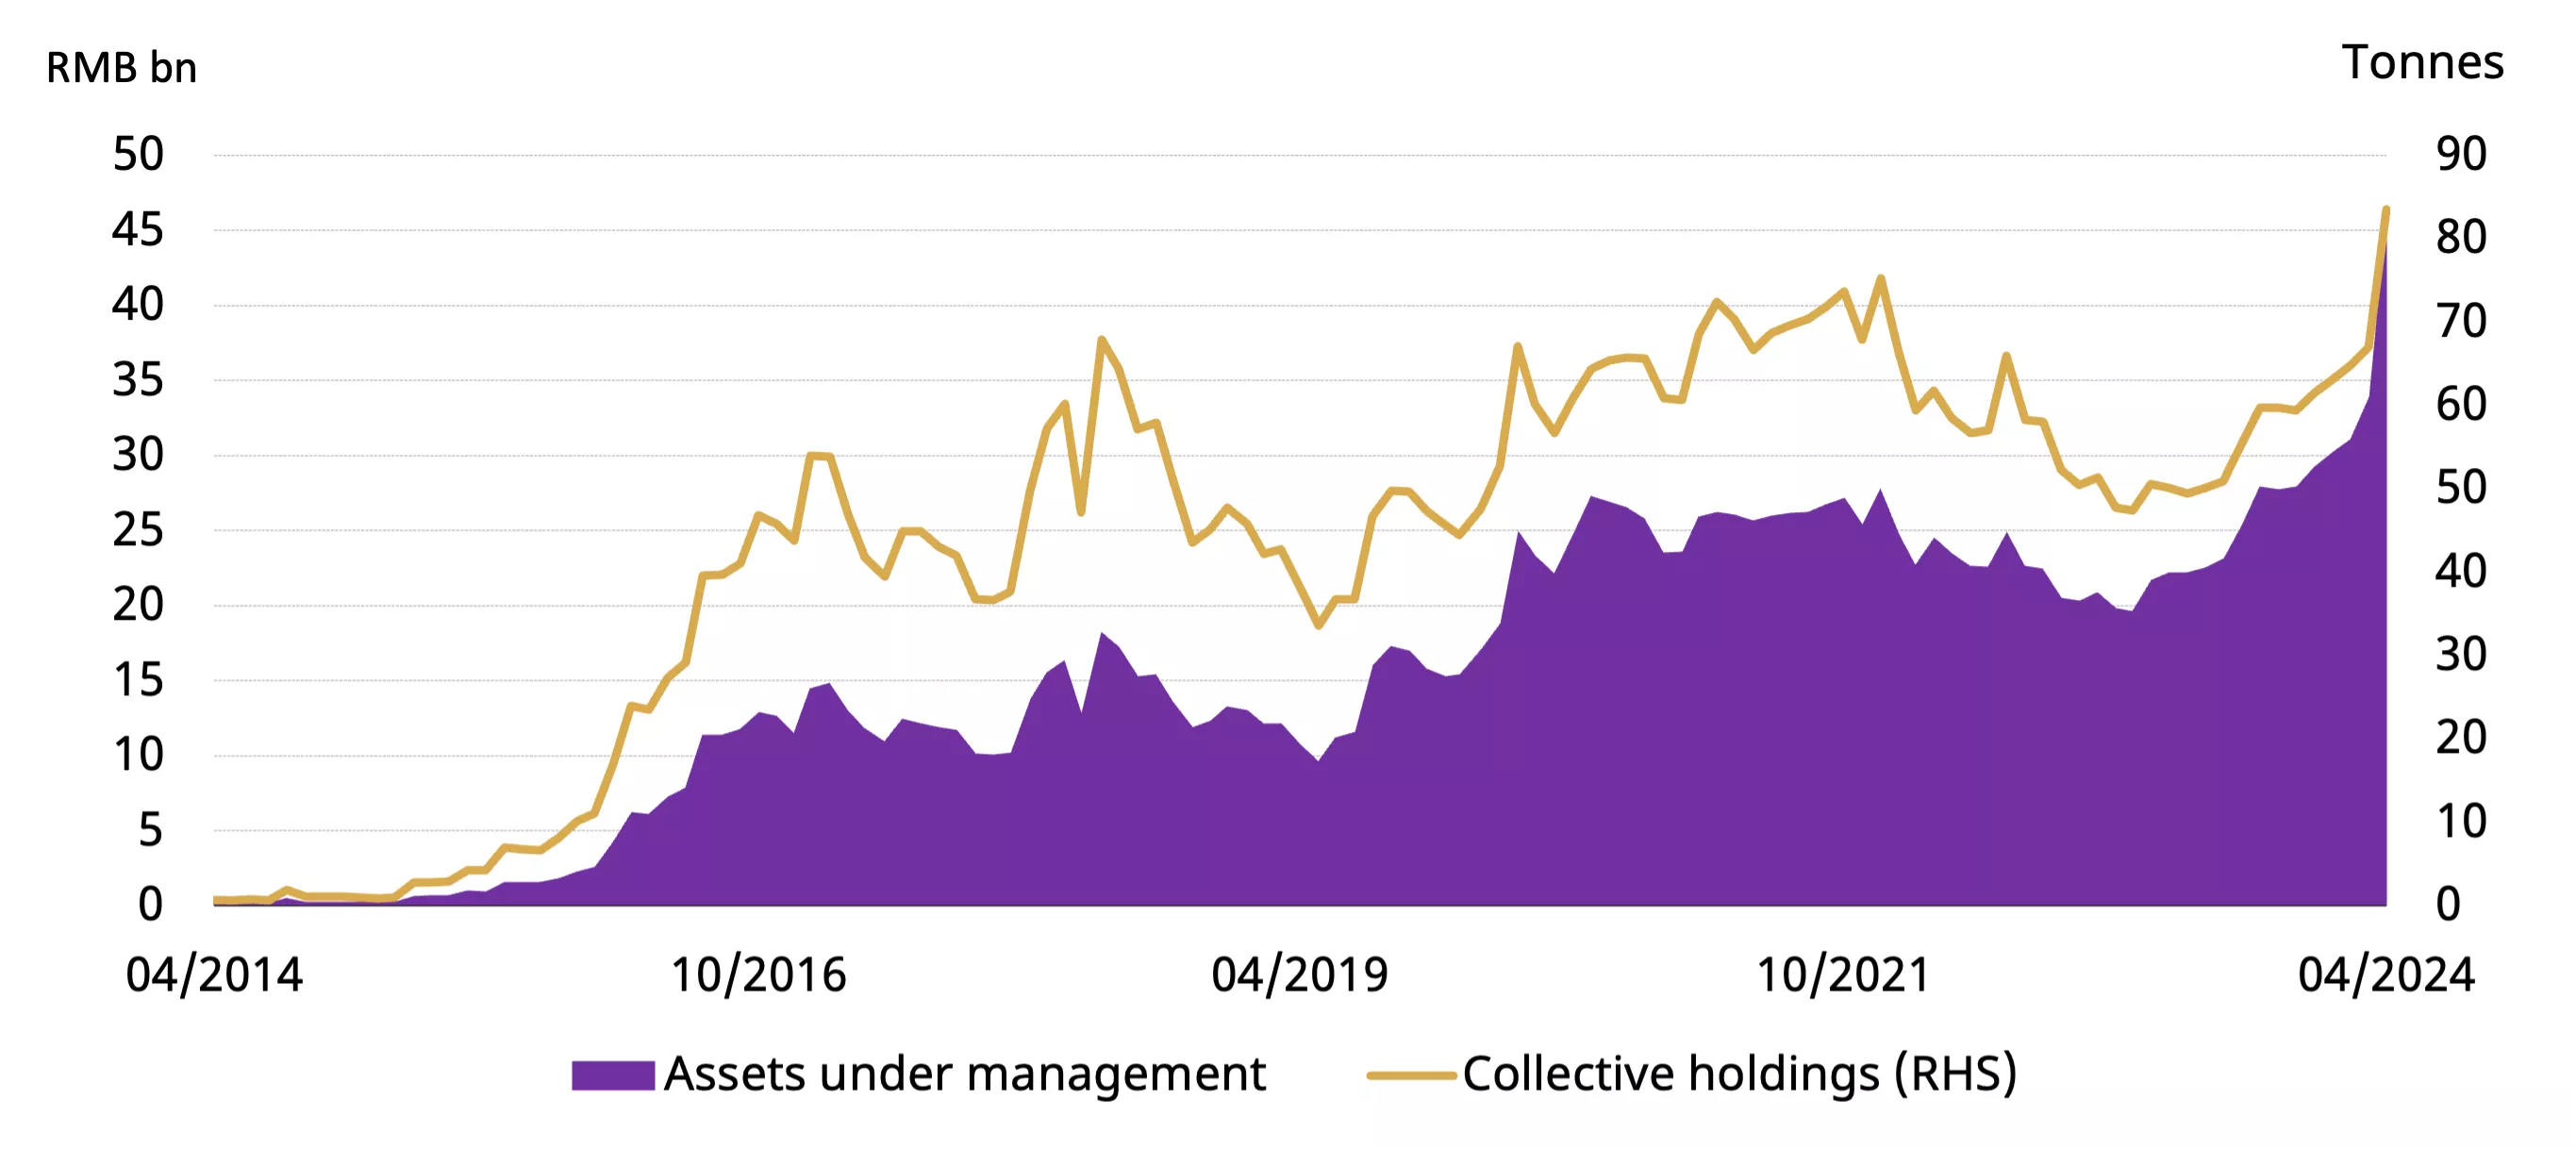
Chinese gold ETFs have seen inflows five months in a row. April attracted RMB9bn (US$1.3bn), the strongest month on record, pushing the total AUM to another historical high of RMB46bn (US$6.4bn). Meanwhile, holdings also registered the largest ever monthly increase, rising 17t to 84t (Chart 5). The ongoing gold price strength, especially in early April, continued to attract investor attention, but as the gold price momentum decelerated towards the end of the month, gold ETF demand in China also cooled.
Chart 5: Chinese gold ETFs recorded their strongest monthly inflow on record
Monthly fund flows and Chinese gold ETF holdings
Source: ETF providers, Shanghai Gold Exchange, World Gold Council
China’s official gold reserves rose 18 months in a row
April saw no stoppage in the PBoC’s gold purchasing spree (Chart 6). Based on the bank’s recent announcement, official gold reserves in China saw their 18th consecutive rise, adding 2t in April. This is the slowest rise since the PBoC resumed announcing gold purchases in November 2022. China’s official gold holdings now stand at 2,264t, accounting for 4.9% of total foreign exchange reserves, the highest ever. So far in 2024, China has accumulated 29t of gold. And during the past 18 months holdings have increased by 316t or 16%.
Chart 6: Gold’s share in China’s reserves rose to the highest on record
Official gold reserves (tonnage) and their share of total foreign exchange reserves*
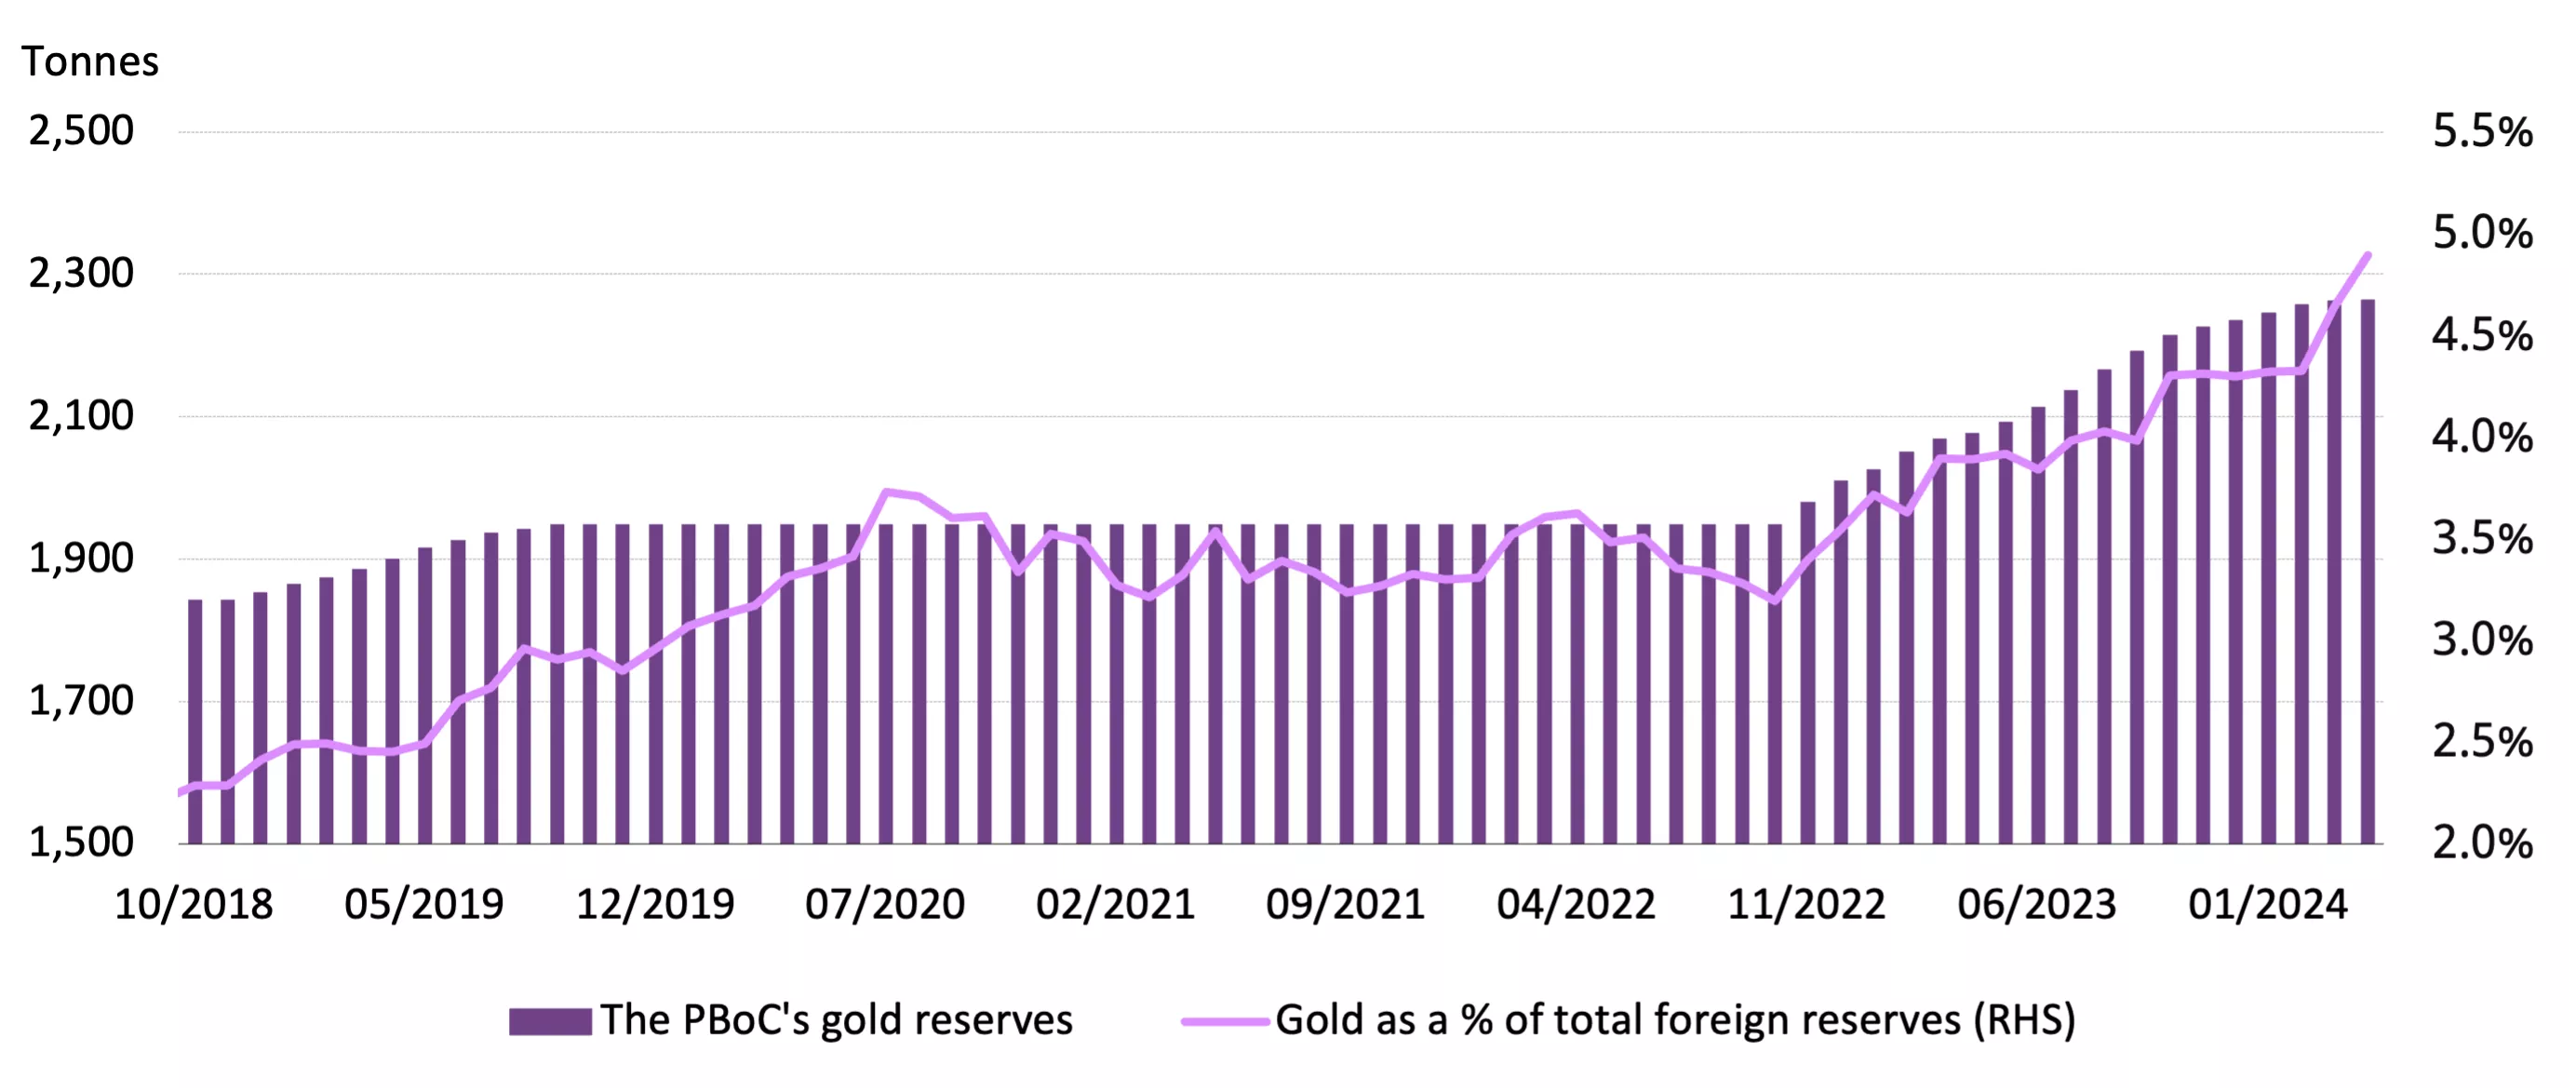
*Gold’s share in total foreign exchange reserves is based on values in USD.
Source: PBoC, World Gold Council
A stable March pushed Q1 imports to the highest since 2015
China imported 85t of gold in March, an 8% rise m/m and a 34% fall y/y. This is in line with local wholesale gold demand trends during the month: stable m/m and weaker y/y. March pushed the Q1 total to 324t, 17% higher y/y and the strongest quarter for imports since 2015 (Chart 7). Rising imports in Q1 were mainly the result of stronger local demand during the quarter.
Chart 7: Q1 gold imports reached the highest in nine years*
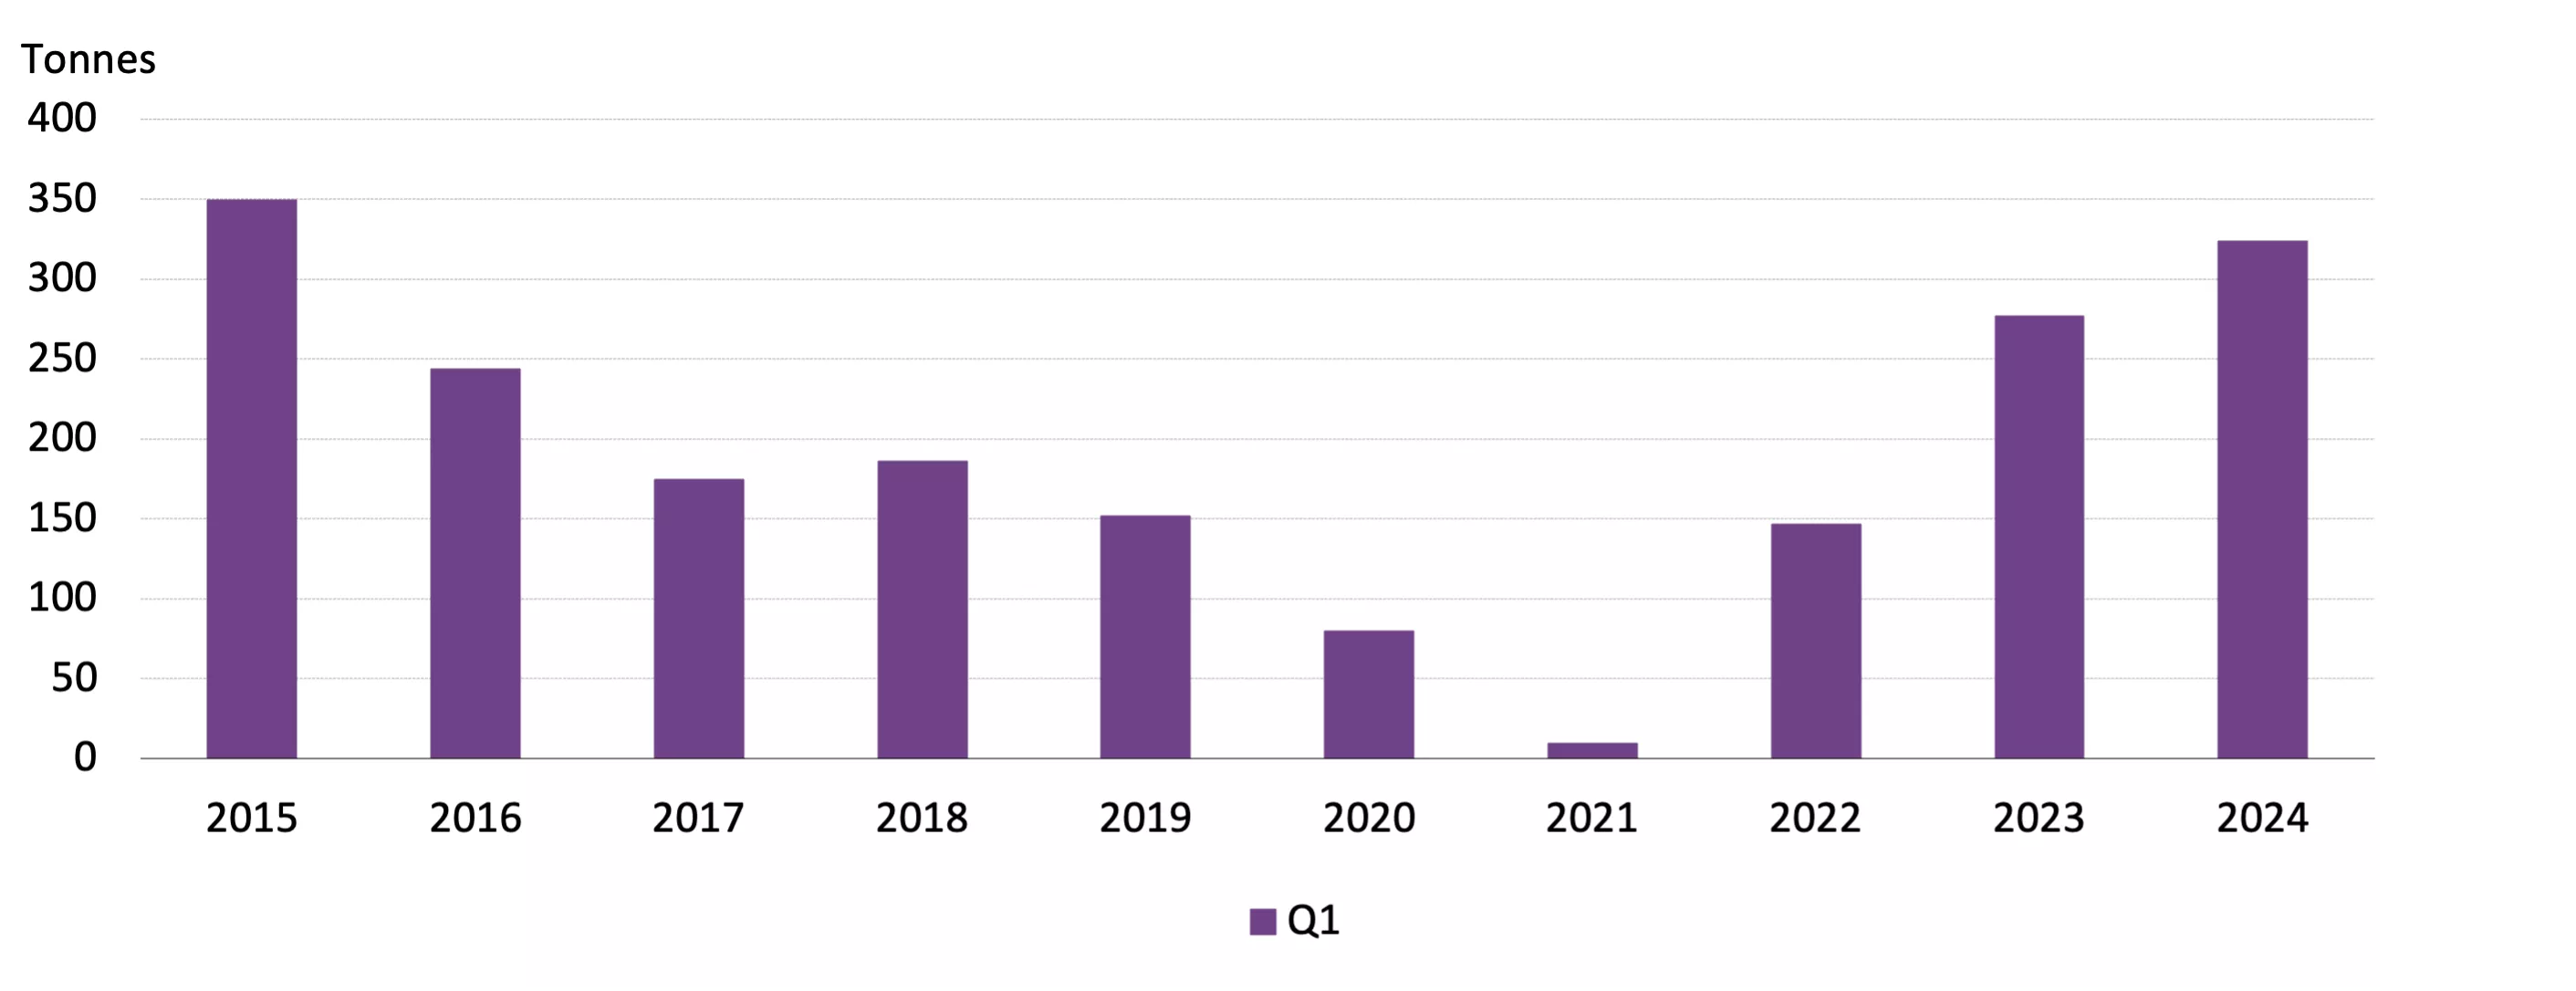
*Based on ordinary trades under HS code 7108 reported by China Customs, excluding exports.
Source: China Customs, World Gold Council
