Key highlights:
- The Shanghai Gold Benchmark PM (SHAUPM) in RMB jumped by 10% in March and the LBMA Gold Price AM in USD rose by 8%. The SHAUPM ended Q1 with a 10% gain, outperforming major local asset classes
- 124t of gold left the Shanghai Gold Exchange (SGE) in March, a mild 3t fall from February as the surging gold price dented demand. But Q1 wholesale gold demand rose to its highest since 2019, totalling 522t
- China’s gold price premium retreated in March, reflecting weakened local gold demand in the face of the soaring gold price. But the first quarter as a whole saw the highest Q1 premium ever (US$40/oz), driven by strong physical demand during the first two months
- Chinese gold ETFs continued to attract inflows, adding RMB1.2bn (+US$164mn) in the month and pushing total assets under management (AUM) to another record high of RMB35bn (US$5bn); March lifted Q1 inflows to RMB2.8bn (+US$386mn) and total AUM by 20%
- The People’s Bank of China (PBoC) reported the 17th straight monthly purchase in March, adding 5t to its total gold holdings, which now stand at 2,262t or 4.6% of total reserves. China’s gold reserves increased by 27t in Q1
Looking ahead
- As we enter the traditional off season for demand, gold jewellery consumption is likely to remain tepid, especially with a local gold price that keeps refreshing record highs.
- On the other hand, the shining performance of gold compared to other local assets has attracted increasing attention from investors. And this could mean continued strength for gold investment demand in China.
Gold prices ended Q1 with a strong March
Gold soared last month (Chart 1). While the LBMA Gold Price AM saw the largest increase in 12 months, the SHAUPM in RMB rose the most since August 2019 helped by a weaker local currency. Drivers such as strong investment demand for gold globally, elevated geopolitical risks and investor positioning in the futures market contributed to gold’s strength.
Chart 1: Gold prices saw sizable rises during March
Monthly changes of SHAUPM and LBMA Gold Price AM*
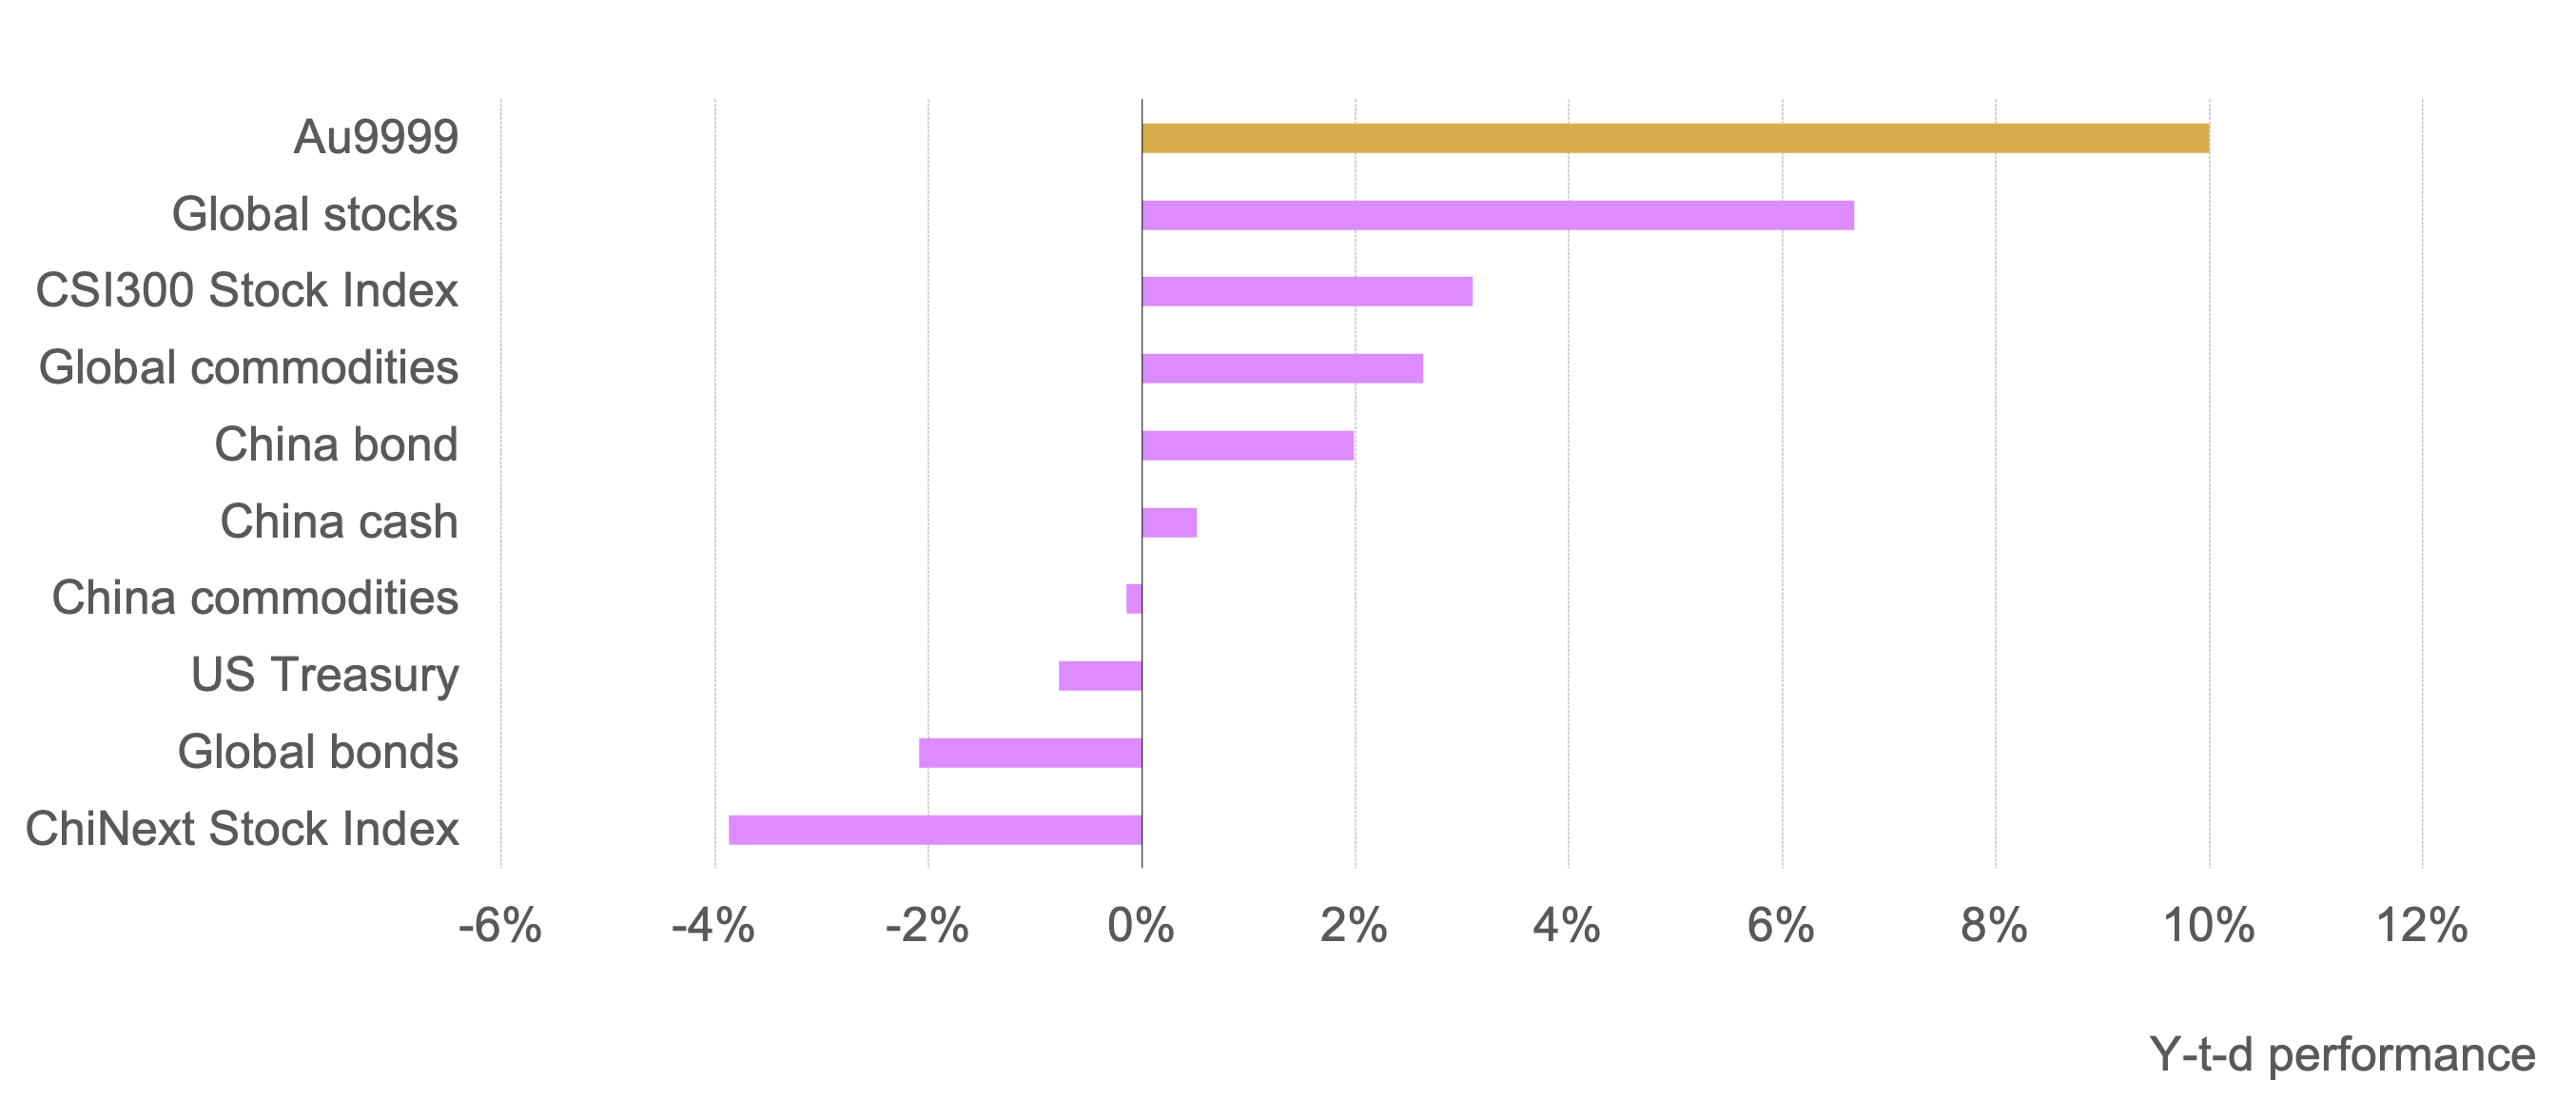
March boosted the RMB gold price’s Q1 return to 10%, outperforming major assets (Chart 2). And the attractive return, uncertainties in the property sector and concerns for the local currency have elevated local investor appetite for gold so far in 2024.
Chart 2: Gold has outperformed local assets during Q1
Major asset performance so far in 2024*
Despite a dip in March, wholesale demand remained strong in Q1
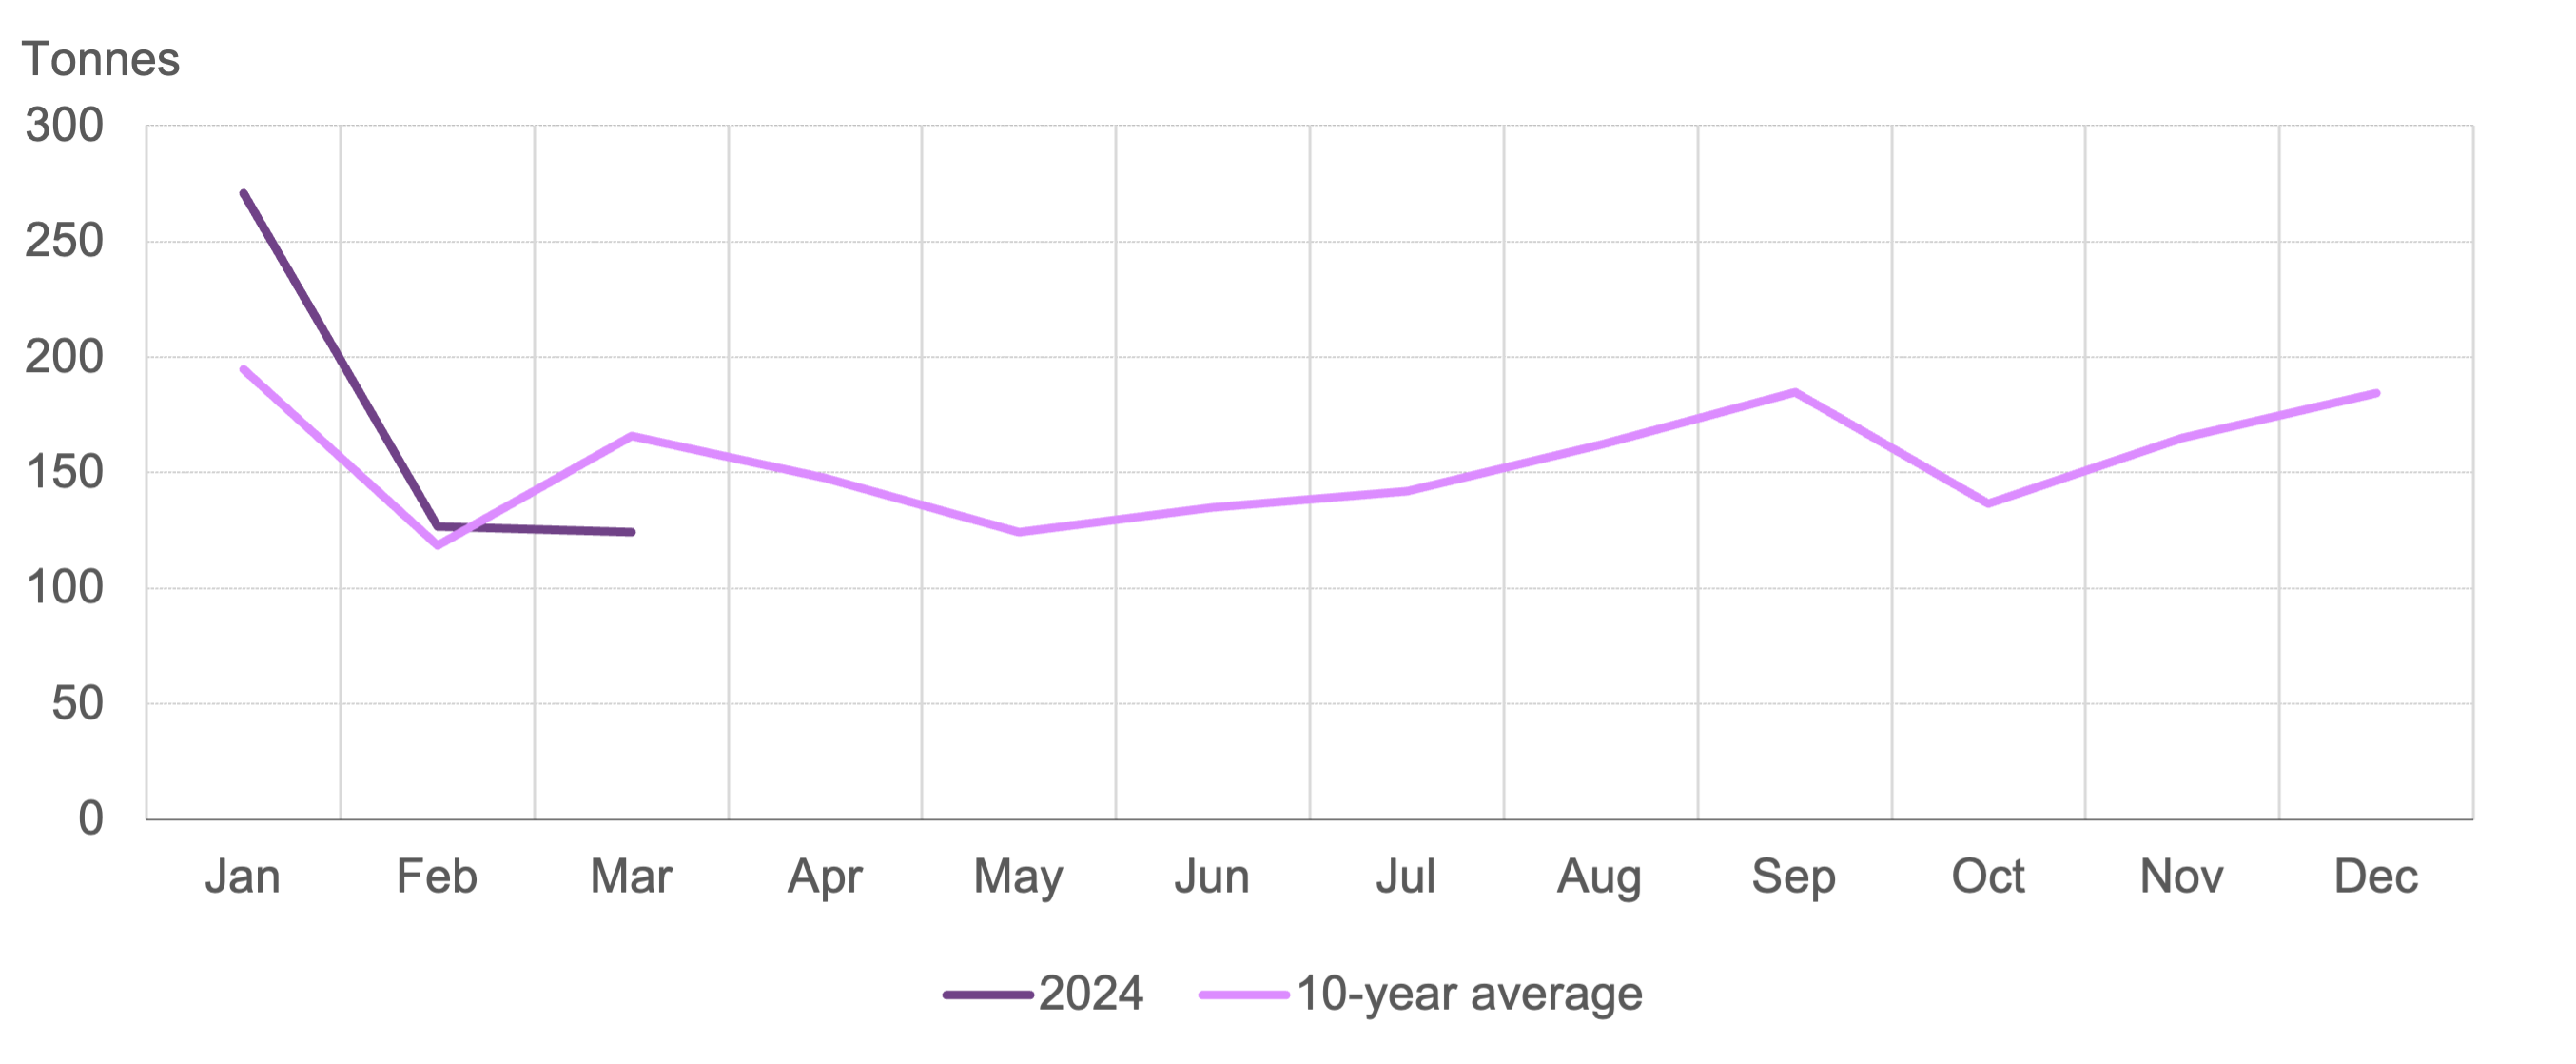
The surging go price more or less weighed on wholesale gold demand in March. During the month, the industry withdrew 124t of gold from the SGE, a mild 3t m/m fall and a 33t drop y/y (Chart 3). Compared to previous years the m/m decline was atypical: March tends to see seasonal growth as manufacturers restock after the traditional sales boost of the Chinese New Year (CNY) holiday, which usually occurs in February. Conversations with gold market participants indicate that gold jewellery retailers were hesitant to replenish stocks amid the rallying price; this was a key factor behind the y/y fall in March withdrawals too.
In contrast, bar and coin sales remained robust with investors paying increased attention to gold amid its recent record-refreshing surge. Strong investment demand for gold may have partially negated gold jewellery market weakness, resulting in only a mild m/m decline in March withdrawals.
Chart 3: March saw a mild atypical m/m dip in wholesale demand
Gold withdrawals from the SGE in 2024 and the 10-year average*
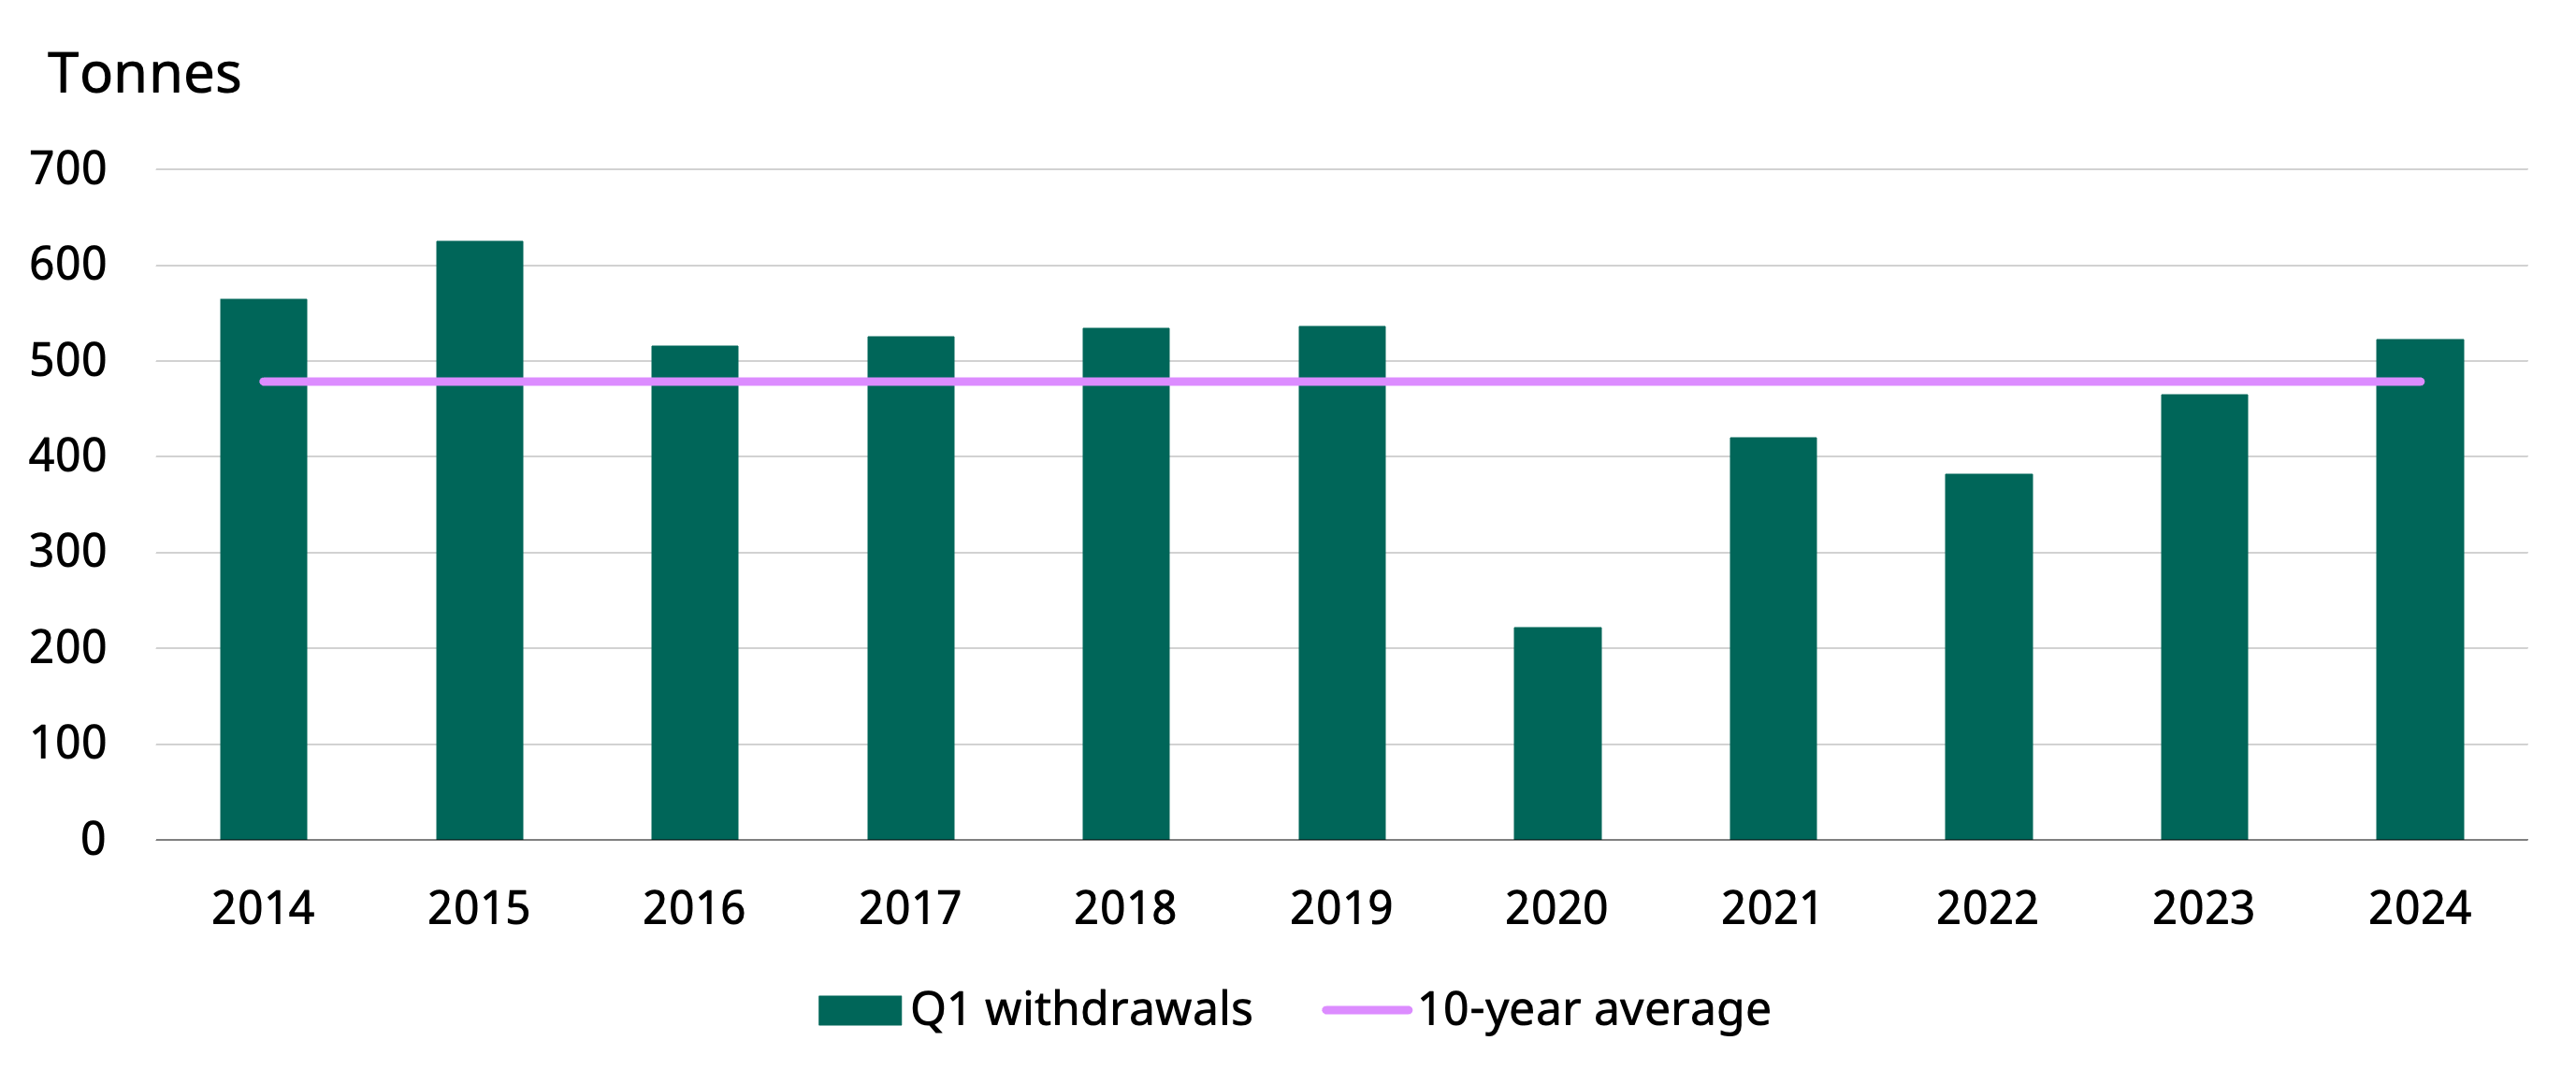
But Q1 wholesale demand was strong: gold withdrawals from the SGE totalled 522t during the first quarter, 57t higher y/y and the highest Q1 since 2019 (Chart 4). Furthermore, withdrawals stand 43t above the 10-year average. Despite a weaker-than-usual March, the strongest January on record and the above-average February shored up Q1 wholesale demand. Active retailer replenishment ahead of the CNY, healthy consumption in early 2024, and elevated investment demand throughout Q1 were key contributors.
Chart 4: Q1 wholesale demand was the highest in five years
Q1 gold withdrawals from the SGE*
Demand fluctuations impacted local price premiums
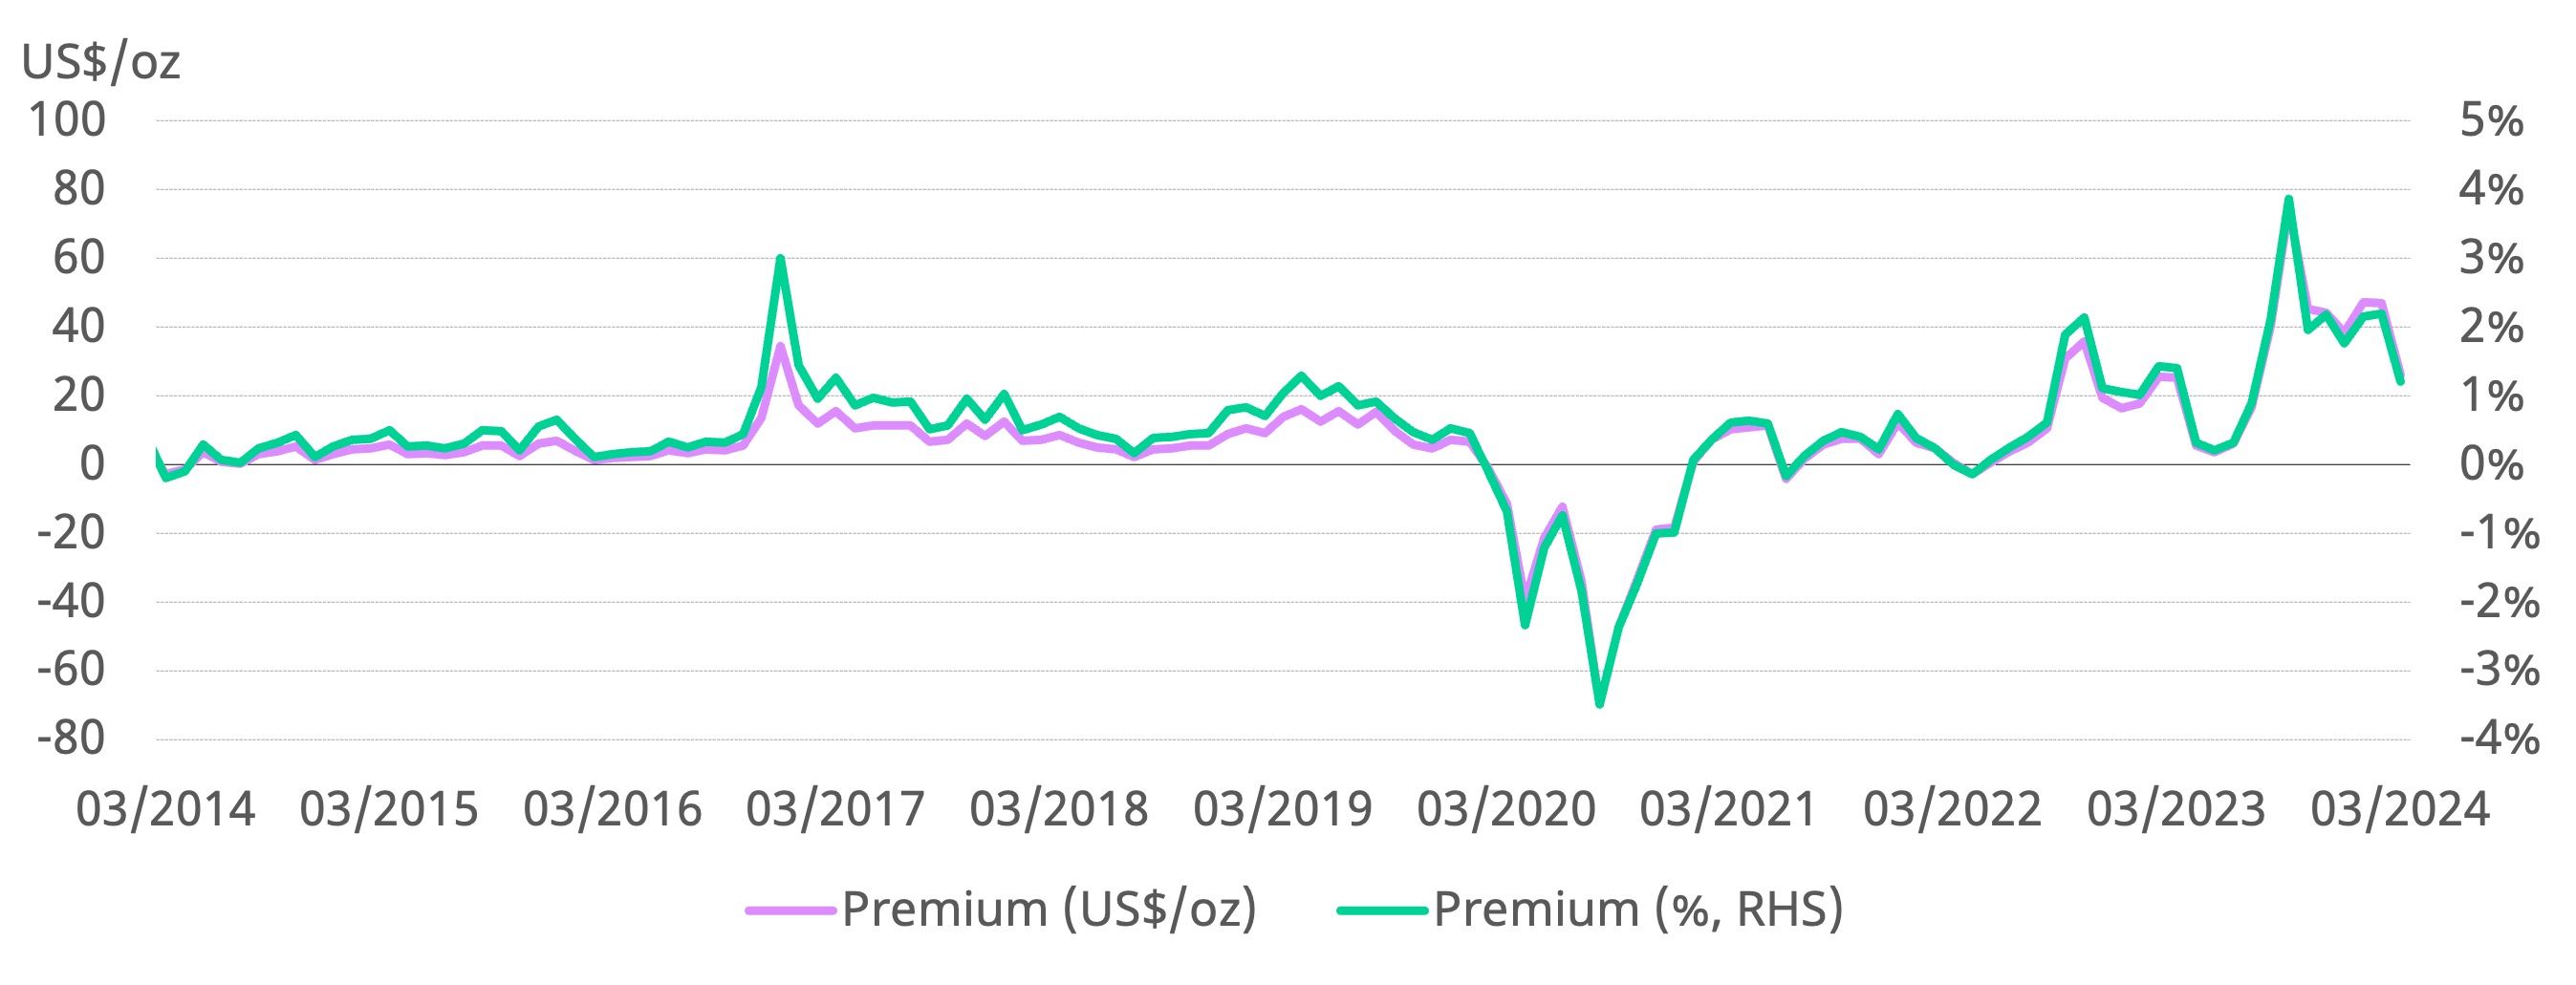
The weakness in March wholesale demand was also reflected in the falling local gold price premium. The Chinese gold price premium averaged US$26/oz in March, a US$21/oz fall m/m (Chart 5). In general, the m/m drop reflected weaker local gold demand, especially in the jewellery market as noted above. And the spread averaged US$40/oz in the first quarter, the highest Q1 ever, mirroring robust local demand mentioned above.
Chart 5: The local gold price premium pulled back in March
The monthly average spread between SHAUPM and LBMA Gold Price AM in US$/oz and %*
Chinese gold ETFs saw sustained inflows in Q1
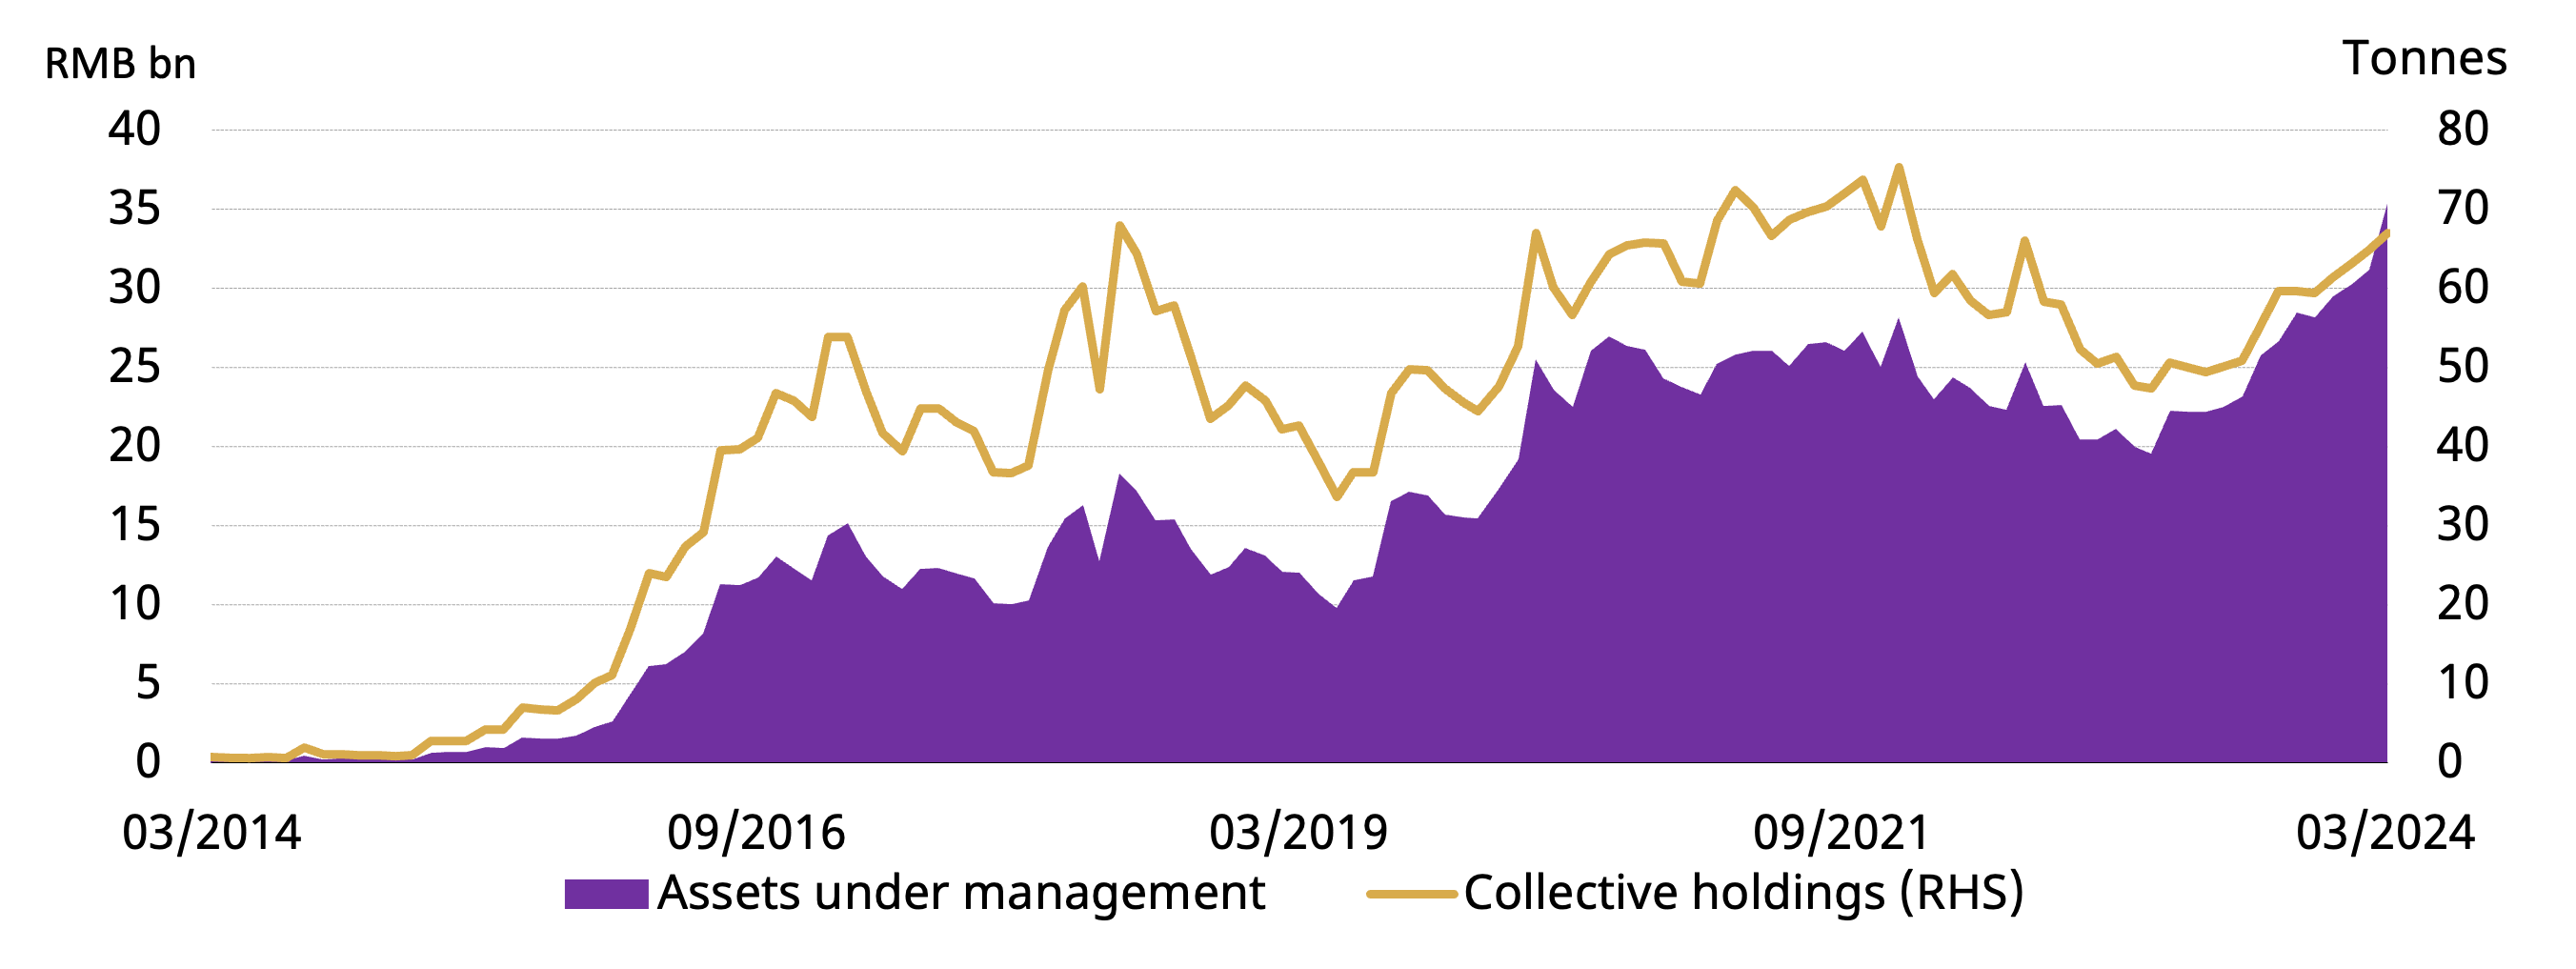
The gold price rally attracted inflows into Chinese gold ETFs, adding RMB1.2bn (US$164mn) in March, the fourth consecutive monthly inflow (Chart 6). Continued inflows and a surge in the local gold price pushed Chinese gold ETF AUM to another record high, reaching RMB35bn (US$5bn) by the end of the month. Meanwhile, holdings rose by 2.2t to 67t, 8t shy of the month-end peak of 75t in December 2021. The strong price momentum in March boosted gold’s allure to investors.
Chart 6: Chinese gold ETFs saw inflows four months in a row
Monthly fund flows and Chinese gold ETF holdings
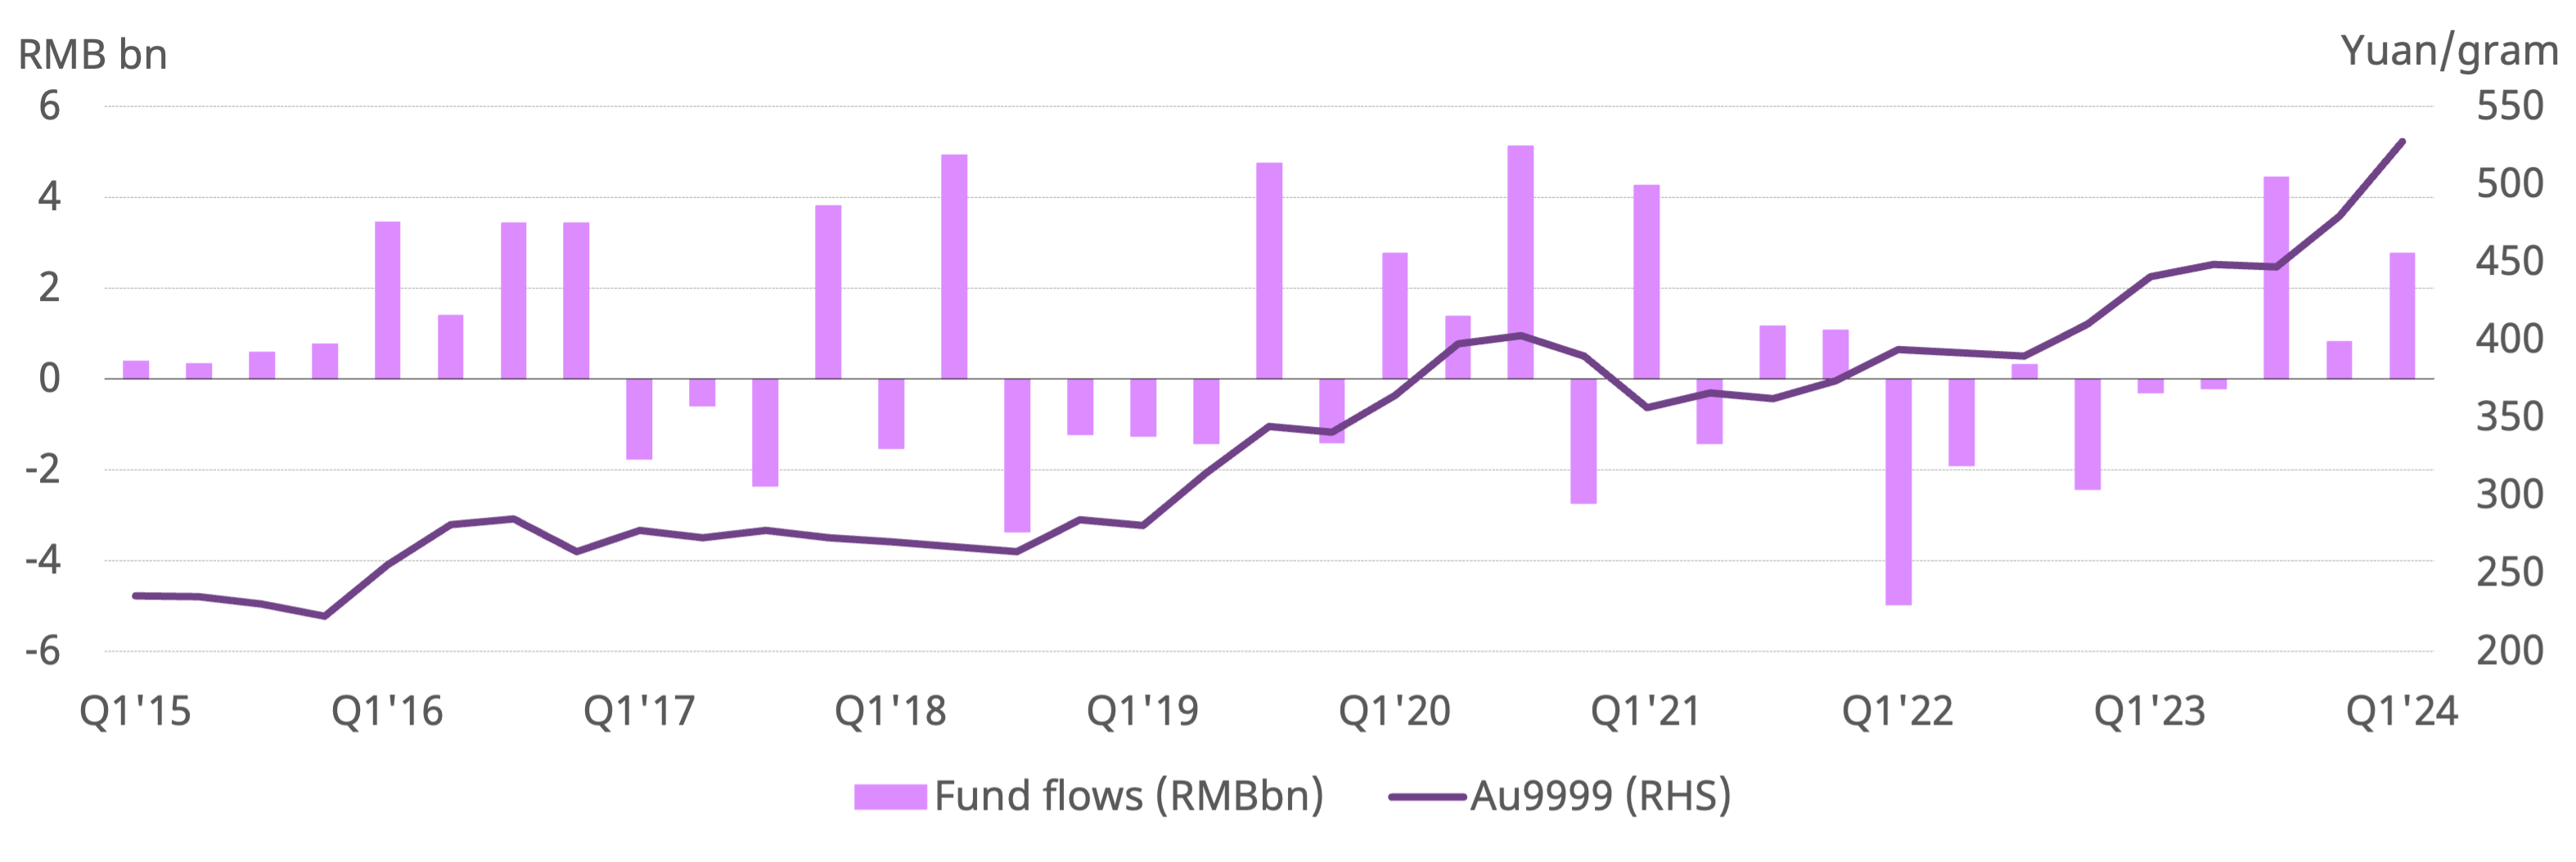
Chinese gold ETFs have seen positive monthly inflows to date in 2024, totalling RMB2.8bn (US$386mn) in Q1 (Chart 7). And these inflows have been relatively evenly distributed each month, suggesting that they were not solely driven by the March price surge; in fact, rising safe-haven demand amid property sector concerns and local currency volatility were key drivers too. While holdings rose by 10% during the first quarter, AUM (in RMB) jumped by 20% thanks to a rocketing RMB gold price.
Chart 7: Q1 inflows improved notably
Quarterly fund flows and Au9999 gold price
China’s central bank announced its 17th consecutive purchase
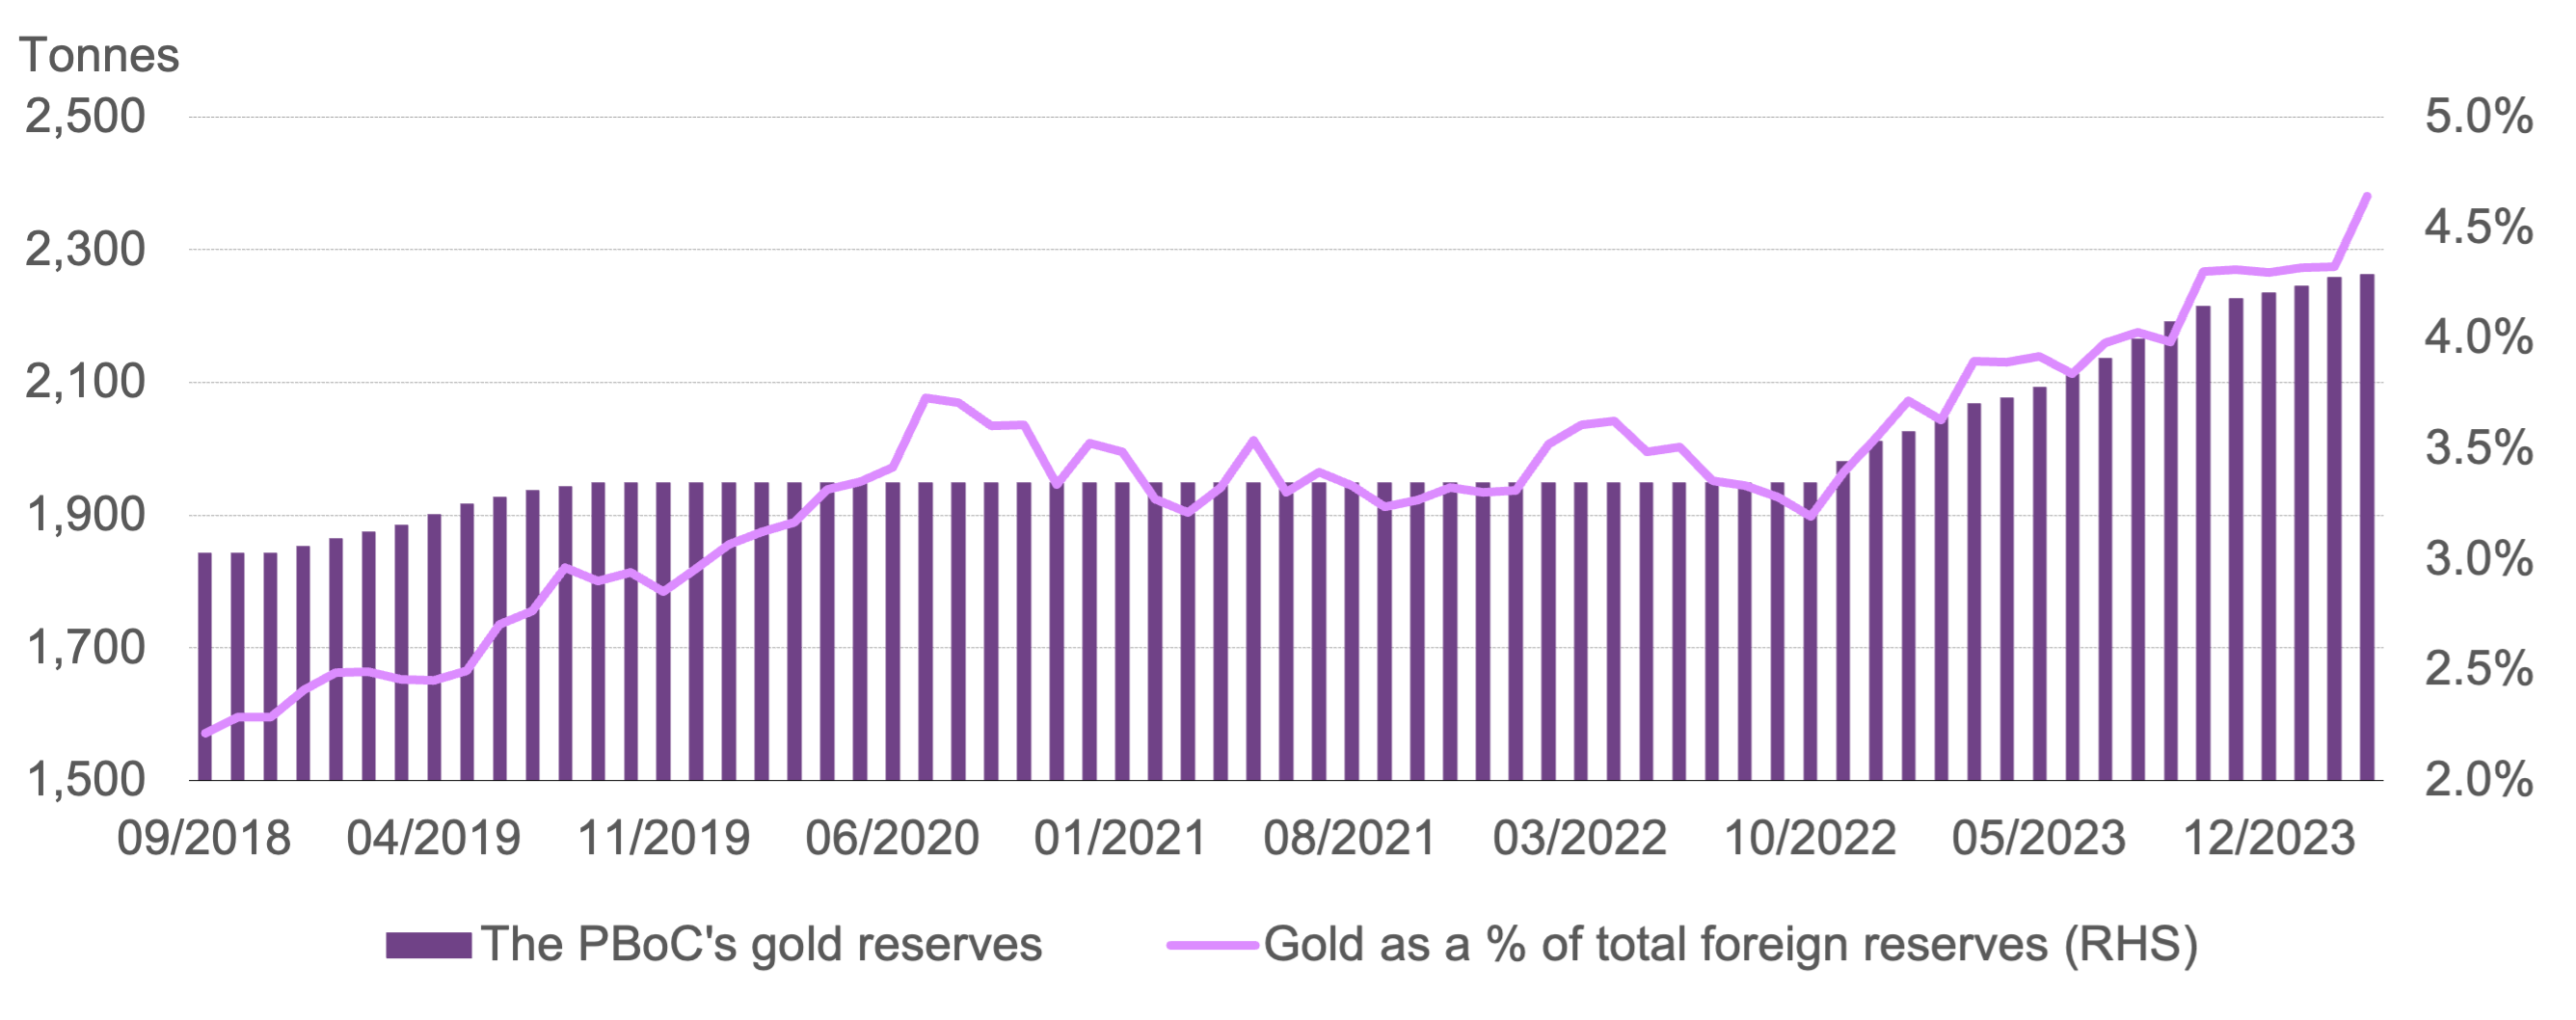
Meanwhile, the PBoC’s gold purchasing spree continued. China’s gold reserves rose by 5t in March, pushing the total to 2,262t and extending the rising streak to 17 months (Chart 8). Currently, gold accounts for 4.6% of total foreign exchange reserves, a notable increase on previous months amid the gold price surge. During the first three months of 2024 the PBoC reported gold purchases of 27t.
China’s gold reserves have risen by 314t since November 2022, the time at which the PBoC resumed reporting. During the same period foreign exchange reserves rose by 5% in dollar terms and official gold tonnage holdings jumped by 14% – their total value surging by 44%.
Chart 8: 17 months of non-stop gold reserve increases
Official gold reserves (tonnage) and their share in total foreign exchange reserves*
Imports mirrored local demand during the first two months
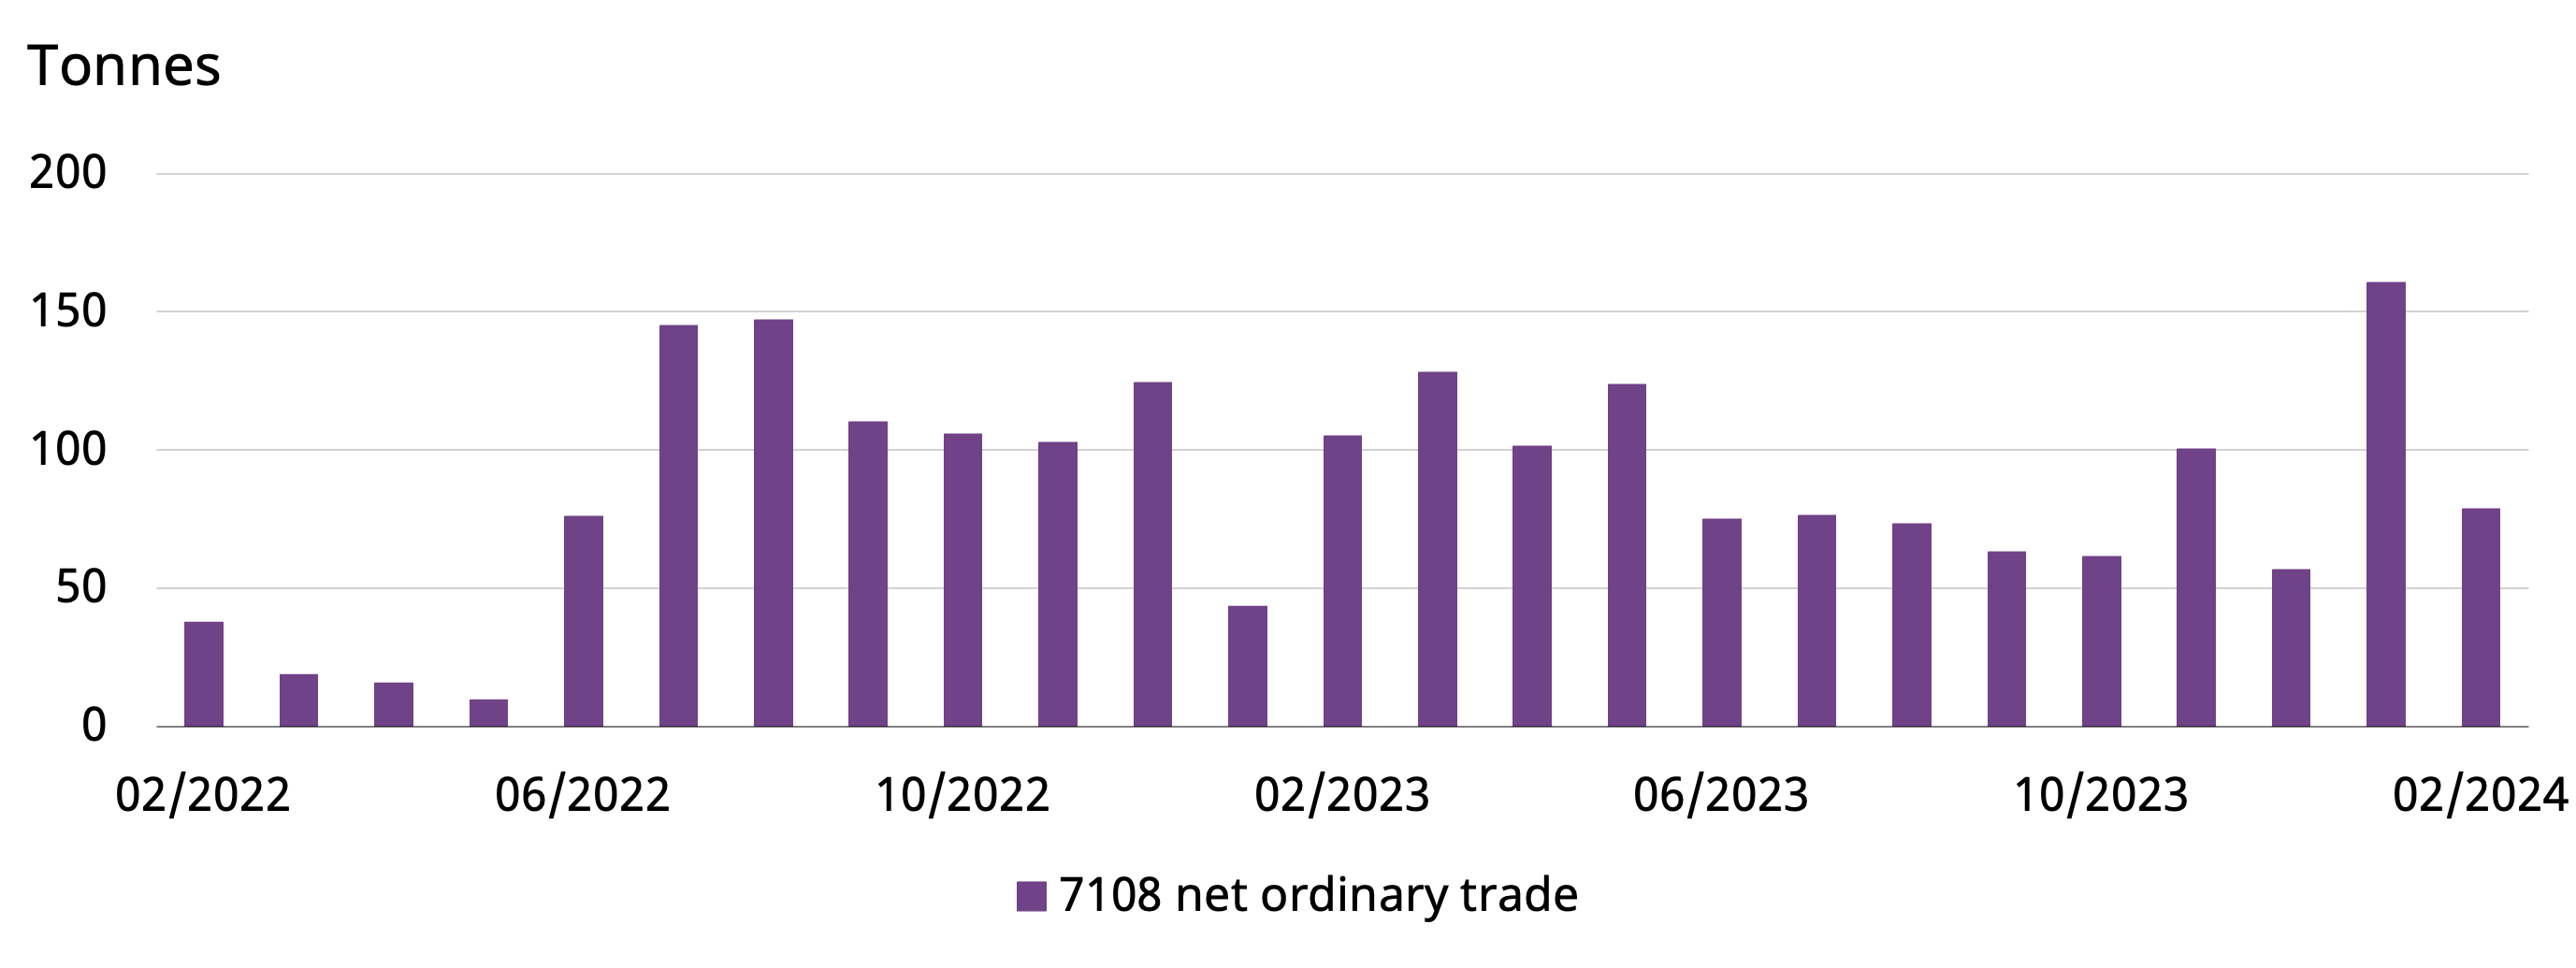
China imported 160t gold in January on a net basis, a significant 104t m/m rise and the strongest January on record according to the latest data from China Customs. This was mainly driven by the strongest ever January wholesale demand and the significantly higher local gold price premium as previously mentioned.
February saw net imports of 79t, an 82t plunge compared to January. The sharp m/m pullback also mirrored changes in February’s wholesale gold demand. Fewer trading days in the month due to the CNY also impacted imports.
Chart 9: Gold imports reflected local demand changes*