Key highlights:
- Both Shanghai Gold Benchmark PM (SHAUPM) in RMB and the LBMA Gold Price AM in USD surged in March, ending Q1 with sizable returns
- The average Shanghai-London gold price premium saw a notable rise in Q1, reflecting improved local demand
- Gold withdrawals from the Shanghai Gold Exchange (SGE) amounted to 157t in March, a minor m-o-m decline of 13t but a 57t y-o-y rise. A resilient March concludes the strongest Q1 wholesale gold demand since 2019
- March saw the first monthly inflow into Chinese gold ETFs in 2023 (+US$3.2bn, +RMB22bn) with holdings increasing by 3.2t. But flows remained negative overall in Q1
- The People’s Bank of China (PBoC) reported an 18t gold purchase in March, the fifth consecutive monthly rise. The 58t Q1 increase took China’s total gold reserves to 2,068t
- China’s gold imports totalled 244t during the first two months of 2023, the strongest start to a year since 2015, coinciding with robust wholesale gold demand during the same period.
Looking ahead:
- Seasonality patterns suggest a slowdown in local gold consumption, which could weigh on wholesale gold demand in April and May. In addition, the elevated local gold price and budget diversion from tourism and other consumption needs may add further pressure
- But there may be upside potential: while the recent local gold price rally might deter consumers, it attracts the attention of investors, especially when they continue to prioritise saving and are prepared to invest more.
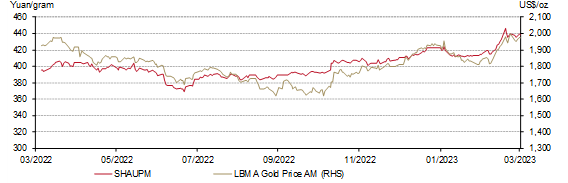
Gold prices ended Q1 with a strong March
Gold prices soared in March as the recent banking industry turmoil underscored systemic risk concerns and cooled expectations of further rate hikes from major central banks. The SHAUPM in RMB rose by 6.5%, ending Q1 with a 7% increase. Meanwhile, the 9.3% surge in the LBMA Gold Price AM in USD last month led to a 9% quarterly gain (Chart 1).
The RMB’s appreciation against the dollar during both March (+1%) and Q1 (+1.2%) were key factors behind the underperformance of the Chinese gold price relative to its USD peer during these periods.
Chart 1: Gold prices jumped in March
The SHAUPM in yuan/gram and LBMA Gold Price AM in US$/oz*
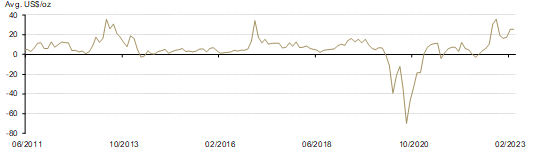
Local premium stabilised
The local gold price premium levelled off, averaging US$25/oz in March, a mild US$1/oz decline m-o-m (Chart 2). This reflected the small m-o-m decline in local wholesale gold demand.
Chart 2: The local gold price premium levelled off
The monthly average spread between SHAUPM and LBMA Gold Price AM in US$/oz*
The Shanghai-London gold price spread in Q1 averaged US$23/oz, significantly higher than previous quarters. Notable recoveries in local gold demand drove the premium rebound during the quarter. For more, watch for our upcoming 2023 Q1 Gold Demand Trends report.
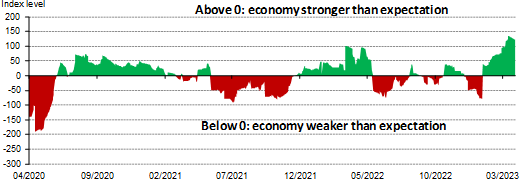
A resilient March for local wholesale gold demand concludes a solid Q1
Chinese economic activities continued to expand in March. While China’s service PMI continued to climb, the manufacturing PMI also beat expectations, albeit falling marginally compared to February. Overall, China’s economic recovery remains on track (Chart 3).
Chart 3: China’s economy shows positive signs despite a marginally slowing pace
Citi bank economic surprise index: China
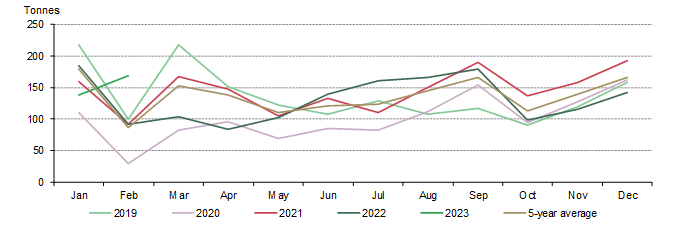
Gold withdrawals also showed resilience: March’s 157t was just 13t lower than the highest February in eight years and 57t higher y-o-y (Chart 4). The m-o-m decline was mainly due to manufacturers' diminishing needs for stock due to their active replenishing in February and the fact that Q2 is traditionally an off-season for gold consumption. The surging local gold price may also have had a negative impact.
Chart 4: March withdrawals were stable
Local gold withdrawals totalled 465t in Q1, the highest since 2019. The end of the COVID pandemic and the economic rebound boosted the recovery in gold demand.
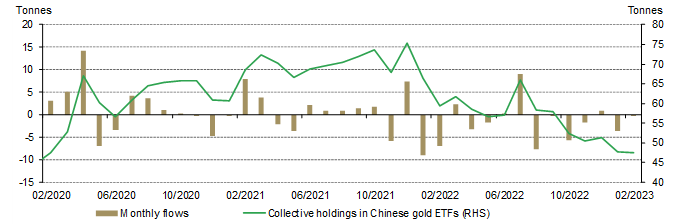
Inflows into Chinese gold ETFs narrowed their Q1 loss
Total AUM of Chinese gold ETFs reached US$3.2bn (RMB22bn) by the end of March, an inflow of US$200mn (RMB1.4bn) in the month. Total holdings increased by 3.2t to 50.6t (Chart 5). The surging local gold price attracted investor attention, leading to the highest monthly inflow since last July.
Chart 5: March saw the first Chinese gold ETF monthly inflow in 2023
Monthly fund flows and Chinese gold ETF holdings
But the inflows in March failed to match the combined losses during January and February, at which time economic recovery hopes had heightened local risk appetite. Chinese gold ETFs saw a mild net outflow in Q1 of US$46mn (RMB312mn) and a 0.8t decrease in holdings.
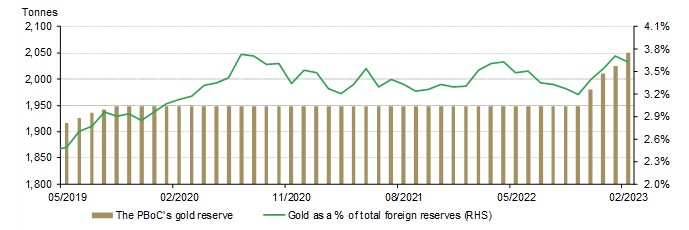
China reported the fifth consecutive monthly rise in gold reserves
China announced an increase of 18t in March, bringing its total gold reserves to 2,068t (Chart 6). The PBoC has announced gold reserve increases every month since November 2022, accumulating 120t over that period.
Chart 6: China’s gold reserves increased further in March
In Q1 2023 the country’s gold reserves increased by 58t, the first quarterly rise since 2019. By the end of Q1, gold accounted for 3.9% of China’s total foreign exchange reserves.
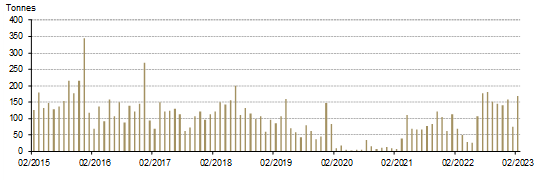
Gold imports remained strong during the first two months of 2023
According to the latest update from China Customs, the country imported 166t of gold in February, a significant rebound from January’s 76t (Chart 7). While the Chinese New Year’s (CNY) holiday limited the number of working days, January was the strongest CNY month of gold imports since 2020 amid the notable demand improvement after the end of the zero-Covid policy.
The rebounding Shanghai-London spread, continued improvement in local demand and the industry’s need for stock replenishment after the CNY holiday. all lifted February imports. As a result, January and February’s combined imports of 244t saw the strongest start to a year since 2015.
Chart 7: China’s gold imports kicked off 2023 with a strong start*
Looking ahead
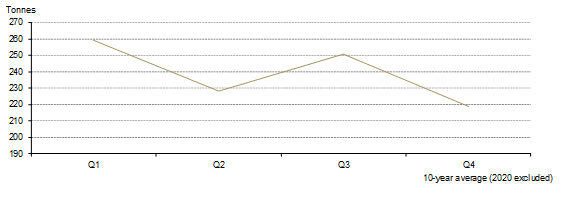
As we enter Q2, local gold consumption is likely to see seasonal weakness leading to lower gold withdrawals in April and May before a rebound in June – manufacturers tend to restock in advance to prepare for the consumption rise in Q3 (Chart 8). Additionally, the elevated local gold price, if it remains so, and budget competition from travelling could add further pressure on local gold demand in coming months. 1
Chart 8: China’s gold consumption usually weakens in Q2
10-year average quarterly gold consumption (jewellery + investment)
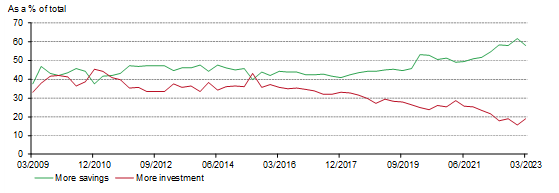
Despite these headwinds, the possibility of a stronger-than-expected Q2 remains. First, while the soaring gold price usually deters gold consumers, it attracts investor attention – the Baidu Search Index for the keyword “gold” rose to its highest in a year during March. Second, local households’ tendency to save hovered around the record level in Q1 and their desire to invest saw a notable rebound from the record low, according to a quarterly survey from the PBoC (Chart 9). This could spur local interest in gold as a value-storing asset, especially when the recent gold price rally impressed many.
Chart 9: Households’ tendency to save remained elevated whilst their desire to invest rebounded
For more outlook commentary, please watch for our 2023 Q1 Gold Demand Trends report later this month
Footnotes
For more, see: Tourism Rebound: China expands outbound group tours to more countries - CGTN.