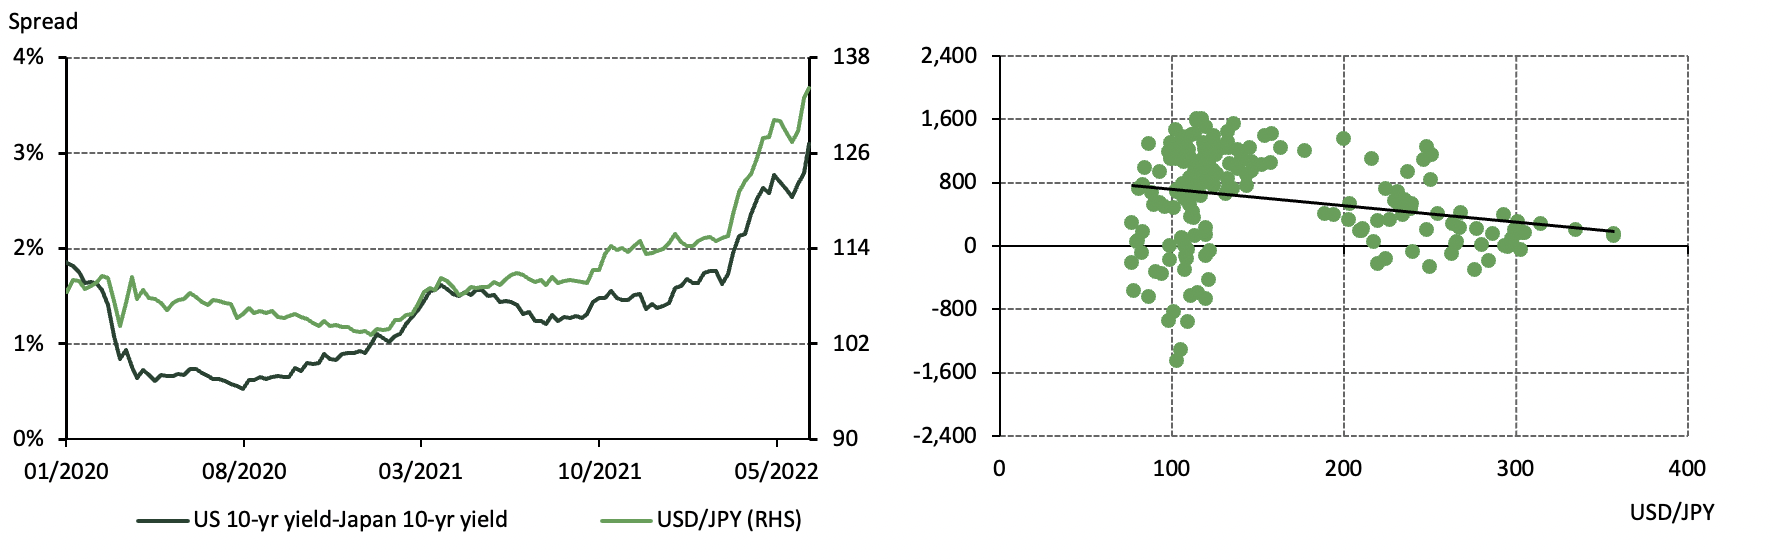
The yen (JPY) has weakened significantly during the first half of 2022: it has registered an 18% depreciation against the US dollar (USD) and now the JPY/USD stands at its lowest point since 1998. Three main factors have weighed on the yen (Chart 1):
- There has been a sharp widening of the interest rate spread between Japan and other key markets, such as the US, as the Bank of Japan (BoJ) continues its ultra-easing monetary policy to support the local economic recovery; in contrast, other major central banks are accelerating their tightening policies to cool inflationary pressure
- Japan’s worsening trade deficit – driven by higher raw material costs and a growth slowdown in major export markets such as China – has contributed to local currency weakness
- Japan’s economic declaration in the first quarter – primarily due to the spread of the Omicron variant and higher import costs – also weighed on the yen.
Chart 1: Widening US-Japan yield spread (left) and trade account deficit (right) weighed on the JPY
Source: Bloomberg, World Gold Council
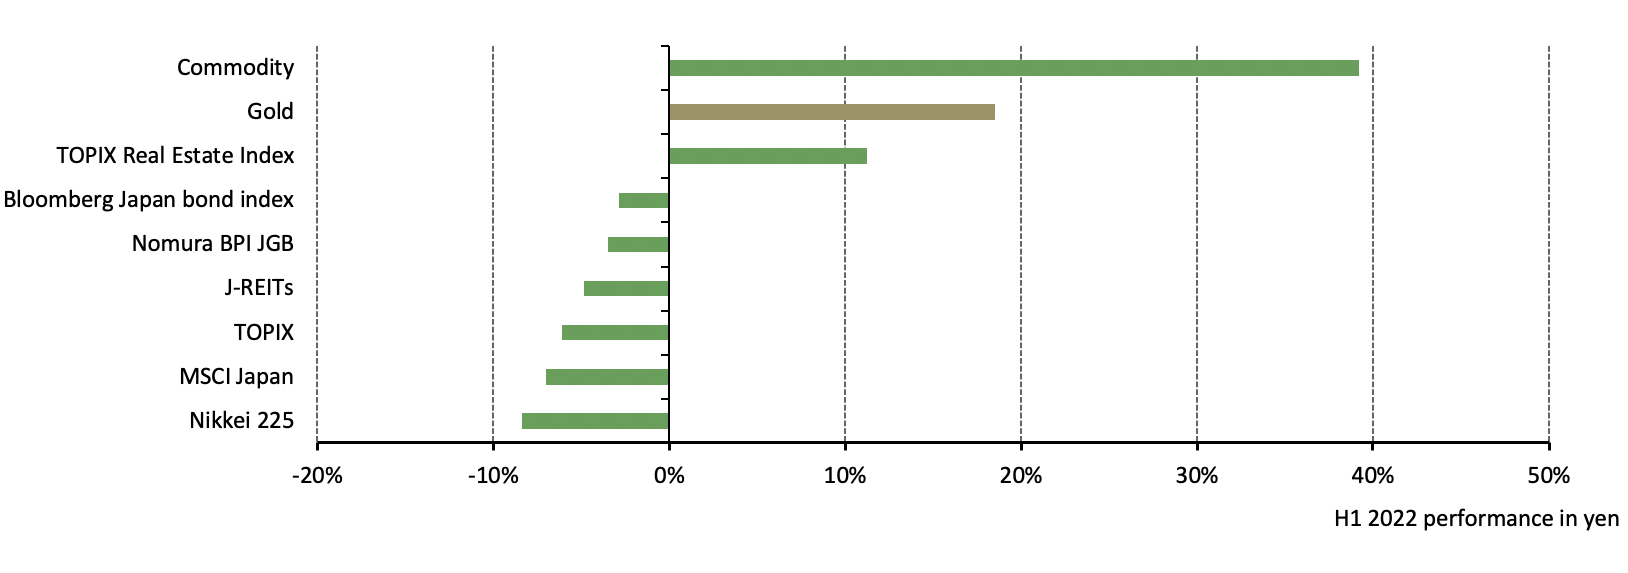
Concerns about slower economic growth and higher costs have not only weighed on the local currency, but also negatively impacted local assets. For instance, the Nikkei 225 stock index has fallen by over 8% in H1 2022 and the local bond index has dropped by 5%.1
But gold’s performance in yen has benefited from this currency weakness. This year uncertainties across the globe, including rising inflation, heightened geopolitical risks and higher financial market volatility, have pushed up the price of gold despite higher interest rates in major regions. And while the international gold price gain was limited by a stronger dollar amid the US Fed’s aggressive rate hikes, its performance in yen staged a 19% return y-t-d (Chart 2).2
Chart 2: Gold – in JPY – has outperformed major Japanese assets
*Based on the Bloomberg Commodity Index, LBMA Gold Price PM, the TOPIX Real Estate Index, the Bloomberg Japan Aggregate Total Return Index, the Nomura BPI JGB Index, the TOPIX Index, the MSCI Japan Index and the Nikkei 225 Stock Index between 31 December 2021 and 30 June 2022. All calculations are in yen.
Source: Bloomberg, World Gold Council
As an asset universally owned and traded, gold is subject to the law of one price: gold’s value should remain the same to investors in every market across various currencies after factoring in additional costs3, otherwise there will be arbitrage opportunities. This has been the primary driver of gold’s strong performance in non-US currencies as gold’s price in a country’s own currency changes relative to the currency’s value:
Table 1: Gold’s performances in various currencies shows its strength*
*Based on daily data of LBMA Gold Price PM in these currencies and their value relative to the US dollar between 31 December 2021 and 30 June 2022.
Source: Bloomberg, ICE Benchmark Administration, World Gold Council
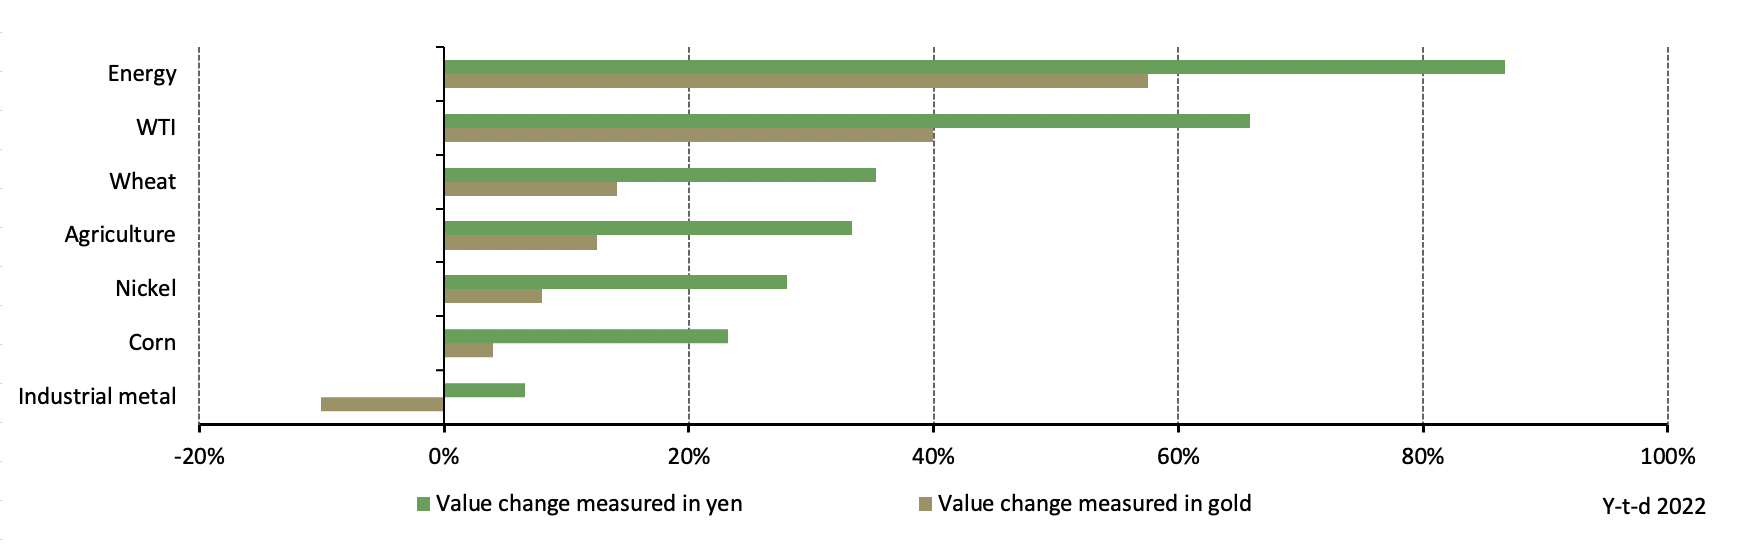
There is an important implication here: gold can help preserve purchasing power. And this may be particularly relevant for Japanese households and investors in the current environment. The yen’s sharp depreciation has compounded significant price increases in the global commodities upon which Japan relies, particularly energy (over 90% of Japan’s energy supply comes from abroad4).
But when we measure the value of commodities by gold, we find that price increases are more moderate than when measured in yen – currency weakness is offset by the strength of gold in yen, as previously mentioned (Chart 3).
Chart 3: Commodity price surges were milder when measured by gold
*Commodities’ value in gold is calculated by dividing the commodity price by gold’s price during the same period. Comparison made between 31 December 2021 and 30 June 2022. All calculations are in yen.
Source: Bloomberg, ICE Benchmark Administration, World Gold Council
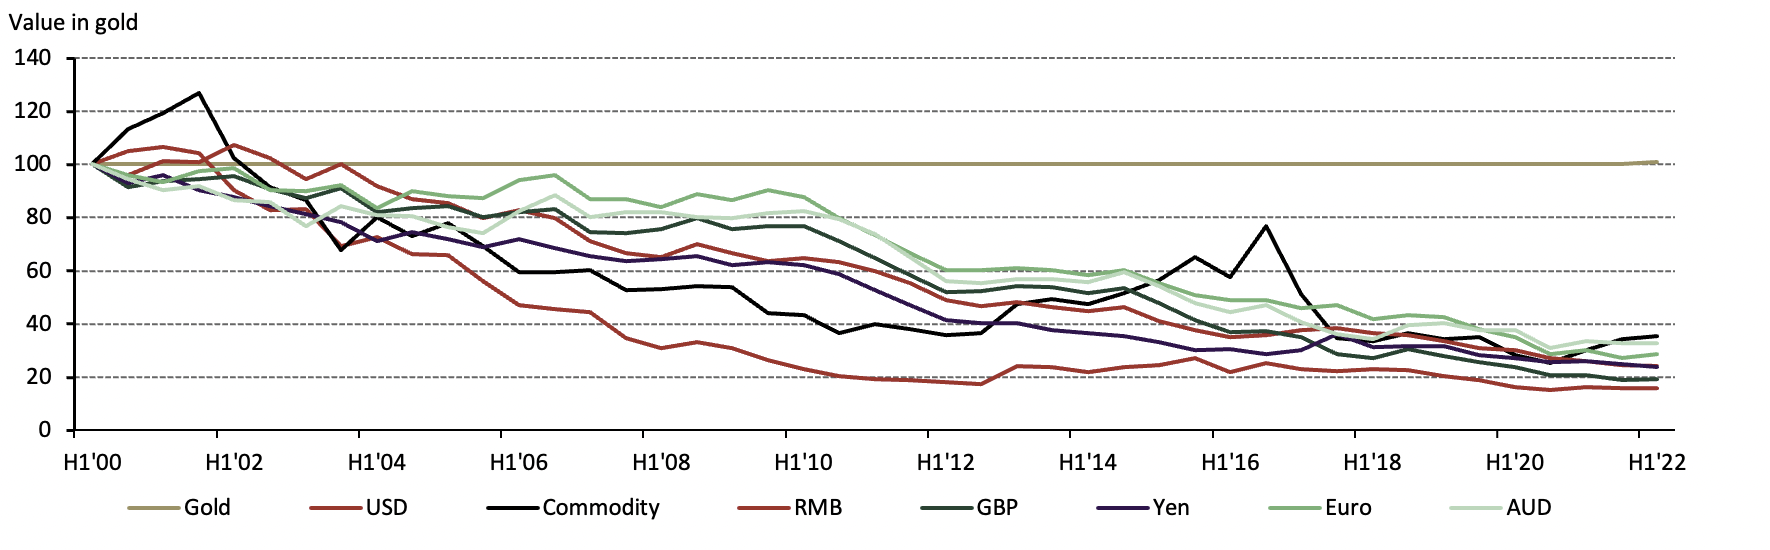
What does this imply? It points to the fact that gold, compared to fiat currencies, could help local consumers hedge a reduction in their purchasing power. And when we look further back into history, gold’s ability to hedge against purchasing power deterioration becomes much more evident (Chart 4).
Chart 4: Fiat currencies and commodities have deteriorated in value relative to gold
* As of 30 June 2020. Relative value between ‘gold’: LBMA Gold Price PM, ‘commodities’: Bloomberg Commodity Index, and major currencies since 2000. Value of commodities and currencies measured in ounces of gold and indexed to 100 in January 2000.
Source: Bloomberg, ICE Benchmark Administration, World Gold Council
Gold’s store of value is underpinned by its stable demand and supply dynamics. Unlike currencies, whose supplies have expanded at a significant pace, especially after the 2008 Global Financial Crisis, mined gold production has averaged 1.6% y-o-y growth during the past 20 years. And diversity in the sources of gold demand – investment and consumption – has contributed to gold’s stable value over time.
As KURODA stated recently, the BoJ is likely to stick with its ultra-easing monetary policy to accommodate the nation’s economic recovery. So the divergence in interest rates between Japan and other key markets such as the US is likely to continue. Meanwhile, with the price of raw materials remaining elevated, Japan’s trade deficit could apply further pressure on the yen.5 A cloudy outlook for the currency will likely continue to negatively impact on the purchasing power of Japanese households, especially when local inflation is rising fast.6 Gold, with its ability to protect purchasing power and hedge against inflation, may become a more relevant asset in Japan going forward.