Gold has come under pressure since mid-March, when it was within touching distance of its previous record high. Since then, gold has fallen over US$200/oz, finding some support at the US$1,800/oz level. Over recent weeks net long positioning on COMEX has been declining and global gold ETFs have witnessed sizeable outflows.
Against this change in sentiment we address four of the most frequently asked questions by investors:
1. Given both equities and bonds have been declining, should gold have performed better than it has?
Gold has proven valuable for investors given the broader macroeconomic context. It remains one of the top-returning assets year-to-date, especially for non-US dollar investors. It has also done significantly better than would be expected based on real rates and the dollar. Furthermore, when put in context of asset performance over the past three years, it has protected capital and served as a source of liquidity.
Gold has performed well in other currencies. As a global asset, it is often important to consider how gold has fared in local currencies. For non-US investors, gold has performed between 2% and 17% better (Table 1).
Table 1: Gold return in key currencies year-to-date*
*As of 13 May 2022. Based on the LBMA Gold Price PM in US dollar (USD), euro (EUR), Japanese yen (JPY), pound sterling (GBP), Canadian dollar (CAD), Swiss franc (CHF), Indian rupee (INR), Chinese yuan (RMB), Turkish lira (TRY), Russian rouble (RUB), South African rand (ZAR), and Australian dollar (AUD).
**Date format: DD/MM/YY
Source: Bloomberg, ICE Benchmark Administration, World Gold Council
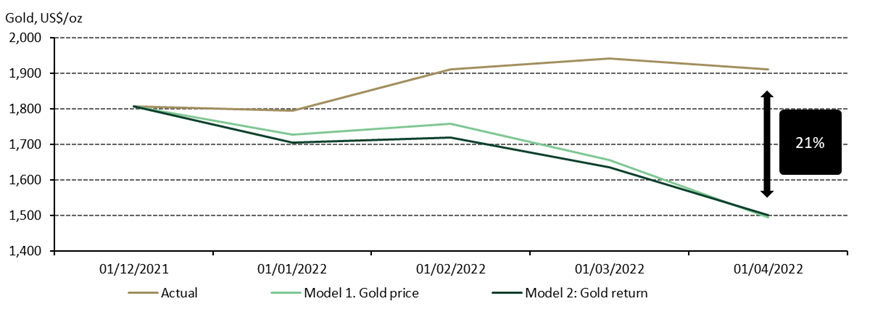
Gold has outperformed what simplistic models suggest. A commonly used model based solely on the direction of the dollar and real rates suggests gold should have been 21% lower than it is now (Chart 1). But last year we highlighted the pitfalls of relying on such a simplistic approach. Why? First, gold’s correlation with the dollar is not always negative. We’ve seen this correlation flip to positive over the past few months – as it has done in the past. Second, rising interest rates can make gold less attractive if they raise the opportunity cost or reflect higher economic growth ahead. Neither of those appear to be true at present. Growth expectations are falling and the opportunity cost – correctly viewed in real terms – remains historically low.
Prior to 2022 investors had bought gold in record amounts. 2020 saw a surge of gold investment. Yet even before the world was besieged by COVID investors were flocking to gold, with 2019 posting the third highest annual inflows into global gold ETFs. So, when the question of gold’s performance comes up in 2022, the answer is that for many investors it has already done what it needs to: protect their capital in a crisis.
Gold carries a liquidity premium and in a ‘sell everything’ environment, some investors often sell what they can to meet redemptions or margin calls. Given gold’s often pre-emptive move higher to such an environment, it lends itself well to the task. We saw this phenomenon in 2008 as gold sold off in March of that year but rallied back in October to a new uptrend and a positive return for the year. With a growing appetite and need for yield, investors who are moving down the liquidity curve to long-term ‘hard-to-liquidate’ assets are finding that having some gold on hand is even more important.
2. Will Fed rate hikes temper the appetite for gold as a safe haven?
At its most recent meeting on 4 May, the Fed raised interest rates by 0.5% and, importantly, indicated that future hikes are unlikely to exceed that magnitude. Rates will continue rising, but at a more gradual pace than had been expected. Given the level of inflation, it is highly likely that real rates will remain negative. Analysis of gold’s performance during different US real interest rate scenarios (Table 2) shows that:
- gold thrives when real interest rates are negative but isn’t hampered when they are between 0%-4%
- gold is better at reducing portfolio risk during periods of moderate real rates, as it benefits from lower volatility and correlation to equities relative to periods of negative real rates.
Table 2: Gold’s performance under negative and moderate interest-rate conditions*
*Computations based on monthly returns relative to different US real rate environments using data between January 1971 and April 2022.
Source: Bloomberg, World Gold Council
The Fed, along with many other central banks, appears to be playing catch up in its attempts to control inflation. If the economy was weathering the prospect of higher rates better, then the story might be worse for gold. But stagflation risks are mounting with every data print, which is supportive for gold in our view.
3. Can you explain why gold and oil seem more correlated recently?
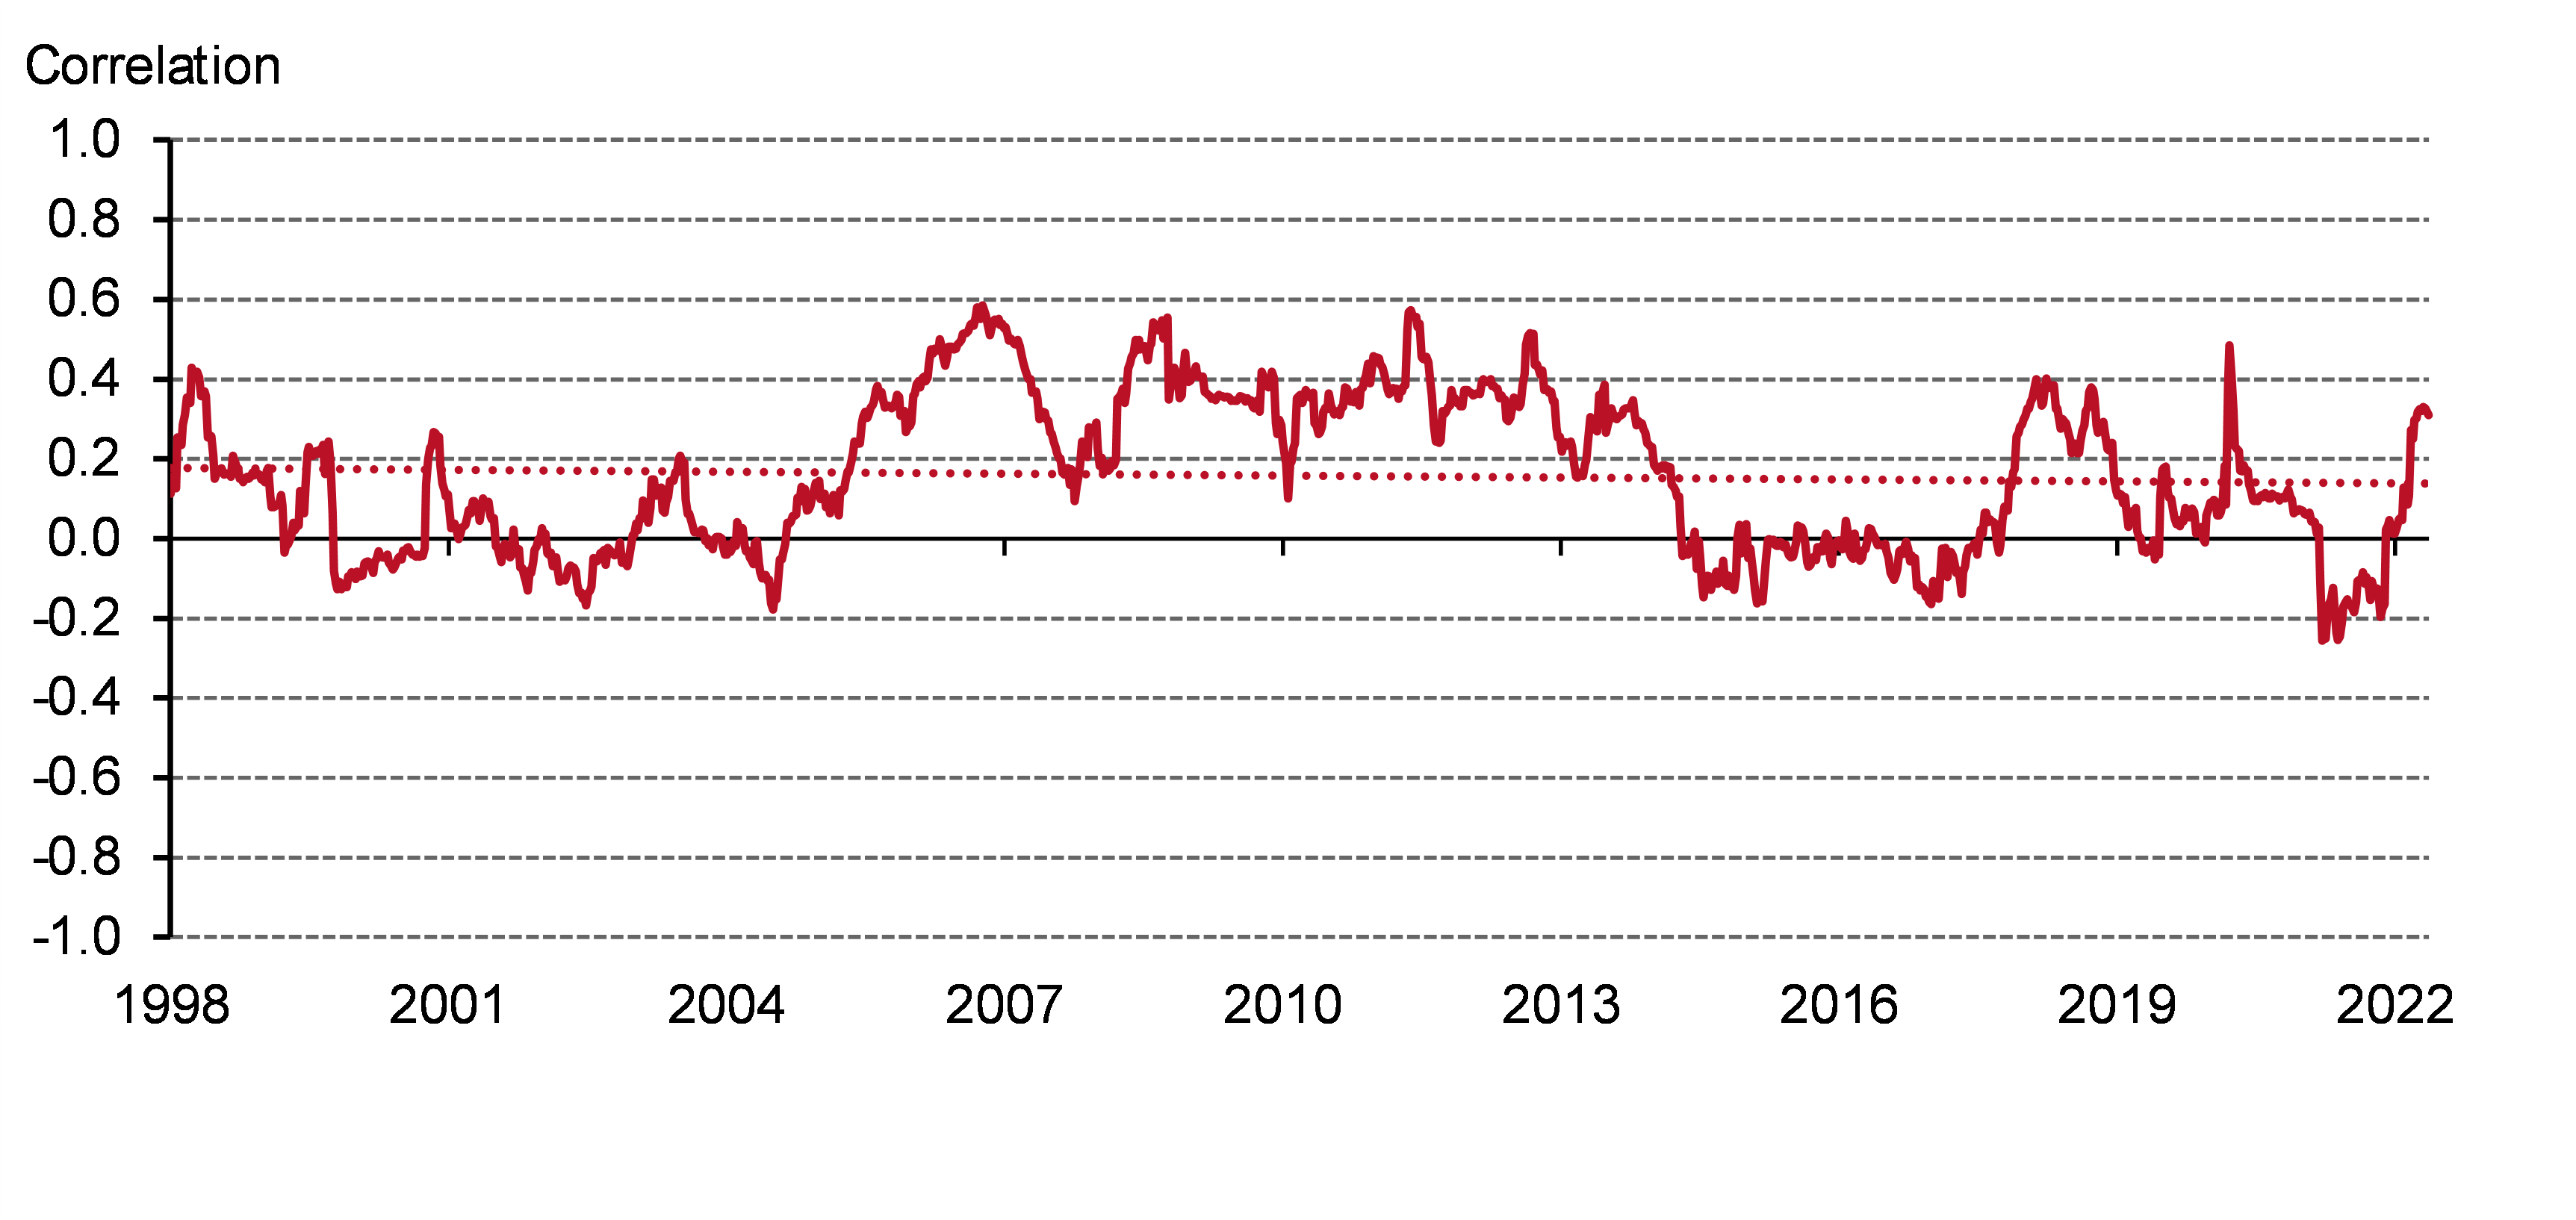
Oil and gold have become more positively correlated over the past year or so (Chart 2). While this happens from time to time, the long-term correlation between the two is generally close to zero, sometimes oscillated between negatively and positively correlated over the last 25 years. For example, the correlation turned negative at near the start of the pandemic in 2020, when oil settled at a negative price and gold rallied 25%.
The rationale for the recent positive correlation centres around heightened geopolitical uncertainty, which has not only boosted the performance of commodities – particularly energy – but also gold specifically, in its role as a hedge. As we’ve discussed previously, gold often lags other commodities in reflationary periods. It is almost a cause-and-effect situation where commodities move higher, creating inflation that some investors then hedge with gold.
Chart 2: Gold’s positive correlation with oil has strengthened recently
One-year rolling monthly correlation between oil (WTI) and gold, based on weekly returns*
4. Where is central bank buying headed?
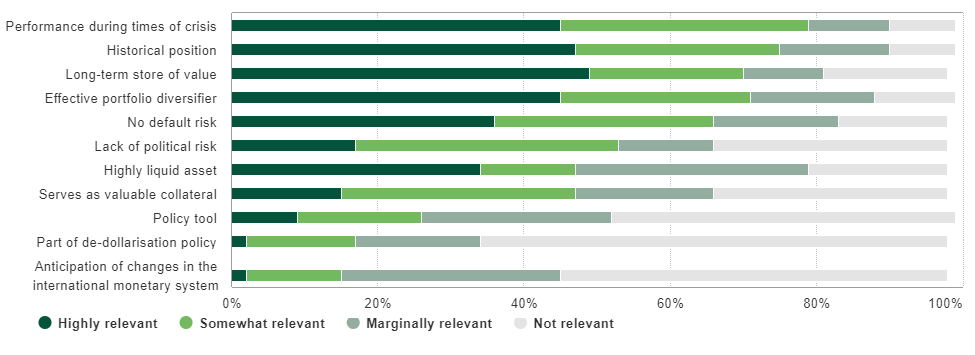
During a turbulent first quarter marked by geopolitical crises and surging inflation, central banks globally added 84t of gold to their reserves. While this is 29% lower y-o-y, it is more than double the previous quarter and, in the main, reflects buying by a few emerging market central banks. This healthy level of demand corresponds with the findings of our 2021 central bank survey: for the first time respondents highlighted gold’s performance during periods of crisis as the top reason to hold gold.
Chart 3: Relevance of factors in central bank’s decision to hold gold
2021 responses, all central banks
Looking ahead, gold might attract further interest as a diversifier as central banks seek to reduce exposure to risk amid heightened uncertainty. We expect central banks to remain net purchasers in 2022; however, slower economic growth and rising inflation may restrain this demand in the short term. We also caution that active management of reserves can result in selling during crises to take advantage of gold’s abundant liquidity.
The results of our 2022 central bank gold survey will be published by the end of June.