• Goldhub
  • Insights
  • Gold breaks 50-day moving average and key support level
  • Gold breaks 50-day moving average and key support level

    30 September, 2019


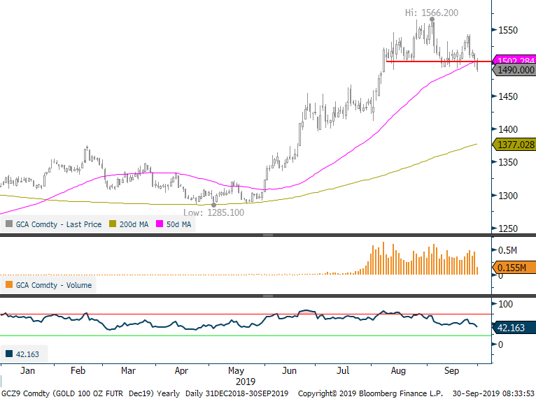
    Gold performance/technicals:

    • Gold fell last week (XAU -1.3%, LBMA -0.8%) as the US dollar strengthened to 2-yr highs. 
    • Gold moved back to the $1,500 level and is breaking that level this morning; a sign of a potential bearish head-and-shoulders break and move below the 50-day moving average.


    Gold Price


    Gold-backed ETF Flows:

    • $2.2bn worth of inflows globally last week mainly coming from the US (+$1.7bn) and Europe (+$534mn)
    • Year-to-date flows are at $17.8bn (370t) or 13% growth in holdings.


    Liquidity/Options:

    • COMEX net longs moved higher near all-time highs (since 2006) from 1,021t to 1,113, well above long-term averages. 
    • Trading volumes fell sharply again, back to ytd averages at $162bn a day, driven primarily by a drop in OTC volumes. 
    • Gold 3m options skew richened (a sign of downside protection-buying) after trading at all-time lows. This is a function of the fall in the gold price and investors buying downside protection. It remains historically inexpensive. Call skew remains rich as investors continue to buy upside exposure.


    COMEX Net Longs 

    CFTC, Bloomberg