Gold as a Reserve Asset
Reserve Asset Management
Central bank reserve managers around the world are responsible for investing trillions of dollars in financial assets. Although the appropriate asset allocation is unique to each institution, almost every reserve manager follows the mantra: safety, liquidity and return. Our analysis shows that gold compares favourably to other traditional reserve assets with respect to these guiding principles.
Safety
Investing in relatively safe assets is one of the most important aspects of a central bank reserve manager’s job. As such, many reserve managers seek financial instruments, such as gold, that help preserve their capital, ensure diversification of their portfolio, adequately mitigate risks as much as possible, and serve as valuable collateral, should the need arise.
Chart 1: The gold price tends to increase in periods of systemic risk
US equities, treasuries and gold versus the VIX index*
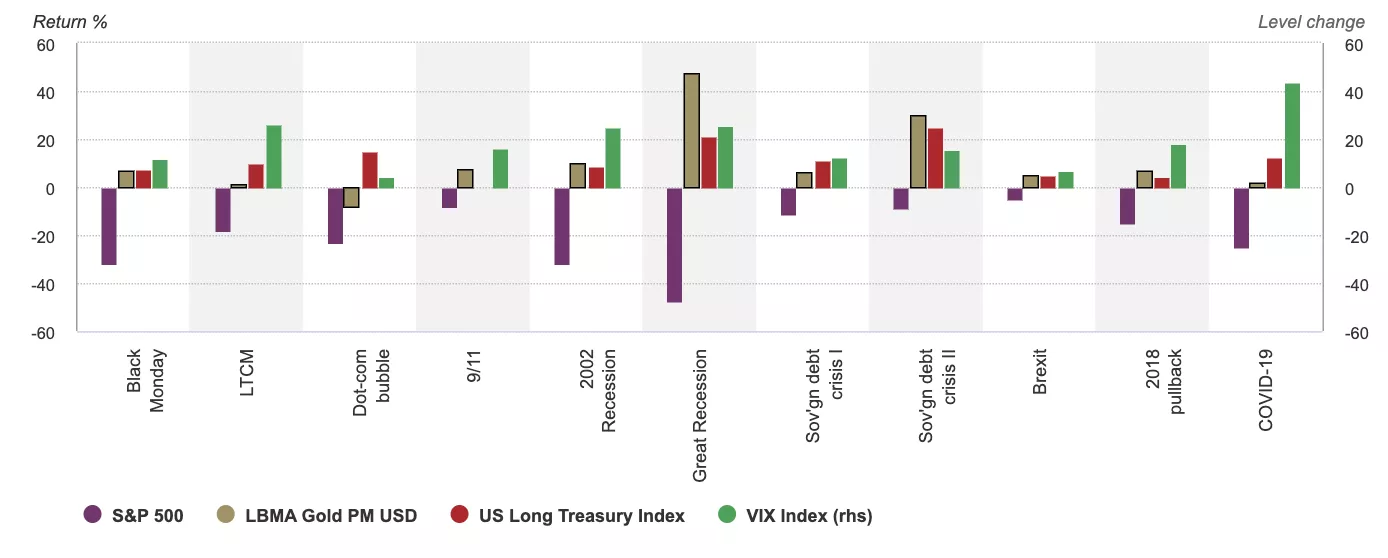
Sources: Bloomberg, ICE Benchmark Administration, World Gold Council
*As of 31 December 2020. Return computations in US dollars for ‘US equities’: S&P 500 Index; ‘US treasuries’: Bloomberg Barclays US Treasury Index; ‘gold’: LBMA Gold Price PM; and ‘VIX’: Cboe VIX Index. The VIX is available only after January 1990. For events occurring prior to that date annualised 30-day S&P 500 volatility is used as a proxy. Dates used: Black Monday: 9/1987 - 11/1987; LTCM: 8/1998; Dot-com: 3/2000 - 3/2001; September 11: 9/2001; 2002 recession: 3/2002 - 7/2002; global financial crisis (GFC): 10/2007 - 2/2009; Sovereign debt crisis I: 1/2010 - 6/2010; Sovereign debt crisis II: 2/2011 - 10/2011; Brexit: 23/6/2016 – 27/6/ 2016; 2018 pullback: 10/2018 - 12/2018; 2020 pullback: 31/1/2020 – 31/3/2020.
Liquidity
For reserve managers, having safe assets is not enough. They need to know they will be able to deploy these assets during times of financial stress, if and when the occasion arises. As the IMF recommends, “reserve managers need to be certain that reserves can be liquidated in a prompt and efficient manner to provide the necessary foreign exchange for the implementation of policy objectives."1 Operating in large markets that rival those of major sovereign bonds, gold is one of the most highly traded financial assets, with low transactional costs and universal acceptance.
Chart 2: Size of major sovereign debt markets and gold
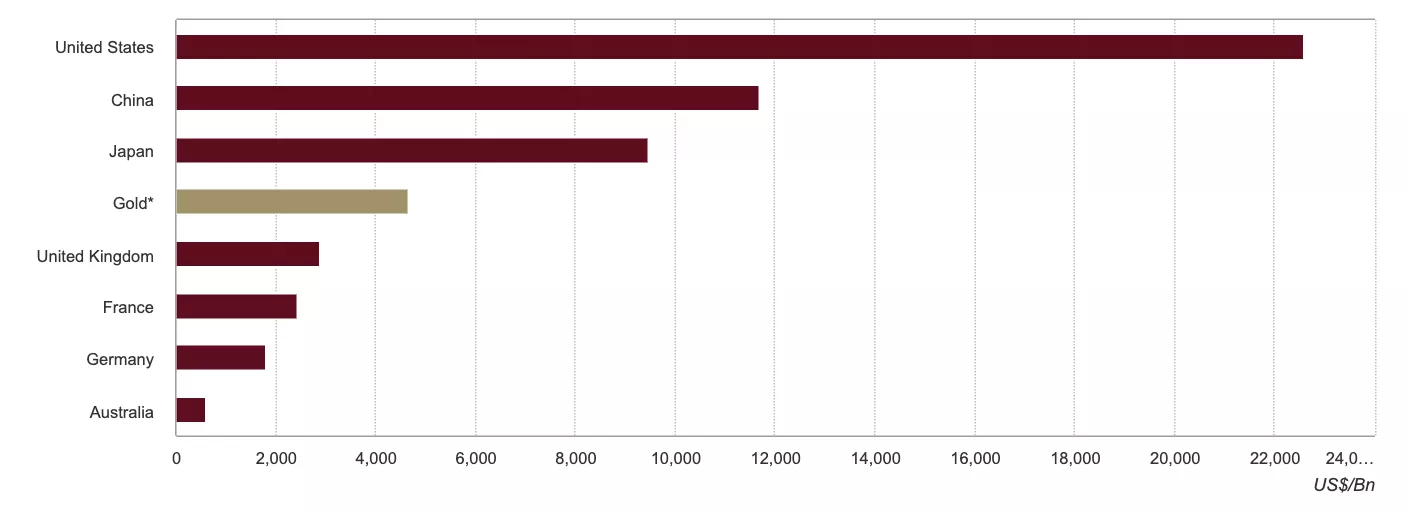
*Gold is the sum of the above-ground stock of bars and coins, ETPs and official sector (or “Financial Gold”). FX and Gold prices updated as of 31 December 2021.
Sources (date updated): US Treasury (31 December 2021), Japan Ministry of Finance (31 December 2021), UK Debt Mgmt Office (7 January 2022), German Finance Agency (5 January 2022), Agence France Tresor (31 December 2021), Australia Office of Financial Mgmt (7 January 2022), ABO (31 December 2021), World Gold Council (31 December 2021)
Return
Although safety and liquidity are certainly the most important aspects of official reserves, the need that many central banks have for return should not be underestimated. For some central banks, the revenue earned on their official reserves represents a significant contribution to overall government funding. Compared to other financial assets, the average annual return on gold, in US dollar terms, has consistently outperformed bonds, while its long-term performance is comparable to stocks.
Chart 3: Gold has outperformed most broad-based portfolio components over the past two decades*
Open Gold has outperformed most broad-based portfolio components over the past two decades* configuration options
Average annual return of key global assets in US dollars*
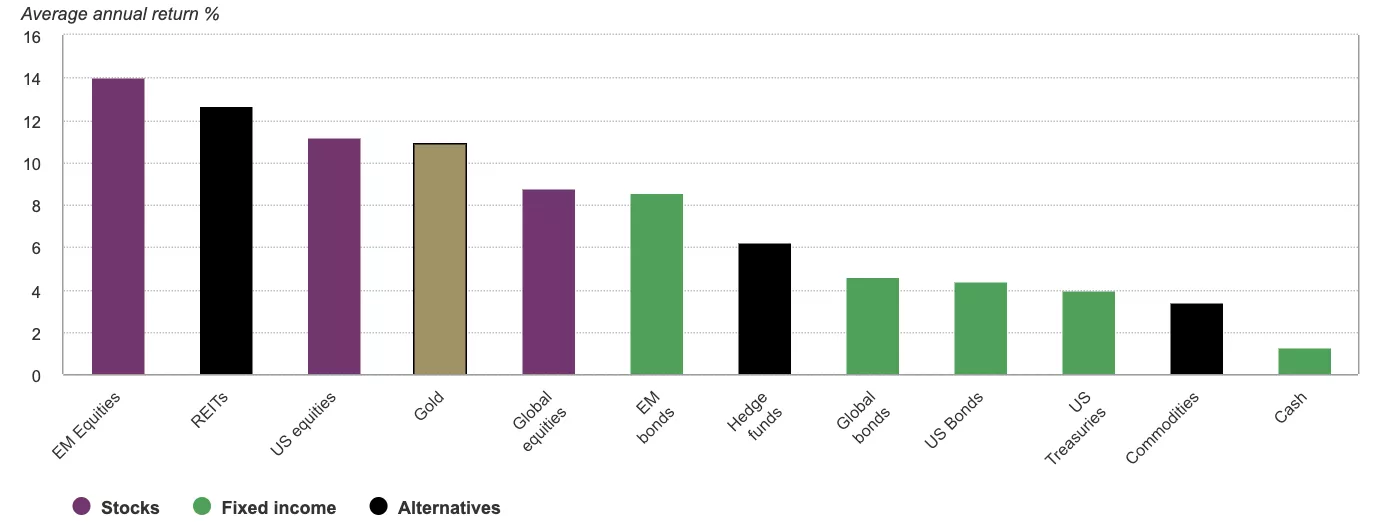
Sources: Bloomberg, ICE Benchmark Administration, World Gold Council; Disclaimer
*Returns from 31 December 2001 to 31 December 2021. Computations in US dollars for ‘cash’: ICE BofA US 3-Month Treasury Bill Index; ‘US bonds’: Bloomberg Barclays US Agg Total Return Value Unhedged USD; Bloomberg Barclays US Treasury Total Return Unhedged USD; ‘Global bonds’: Bloomberg Barclays Global-Aggregate Total Return Index Value Unhedged USD; ‘EM bonds’: Bloomberg Barclays EM USD Aggregate Total Return Index Value Unhedged; ‘US equities’: MSCI Daily TR Gross USA USD; EAFE equities: MSCI Daily TR Gross EAFE USD; ‘EM equities’: MSCI Daily TR Gross EM USD; ‘commodities’: Bloomberg Commodity Index Total Return; ‘hedge funds’: Hedge Fund Research HFRI Fund Weighted Composite Index; ‘REITs’: FTSE Nareit Equity REITs Total Return Index USD; and ‘gold’: LBMA Gold Price PM USD.
Chart 4: Gold has performed well over the past decade, despite the strong performance of risk assets
Average annual return over the past five and 10 years*
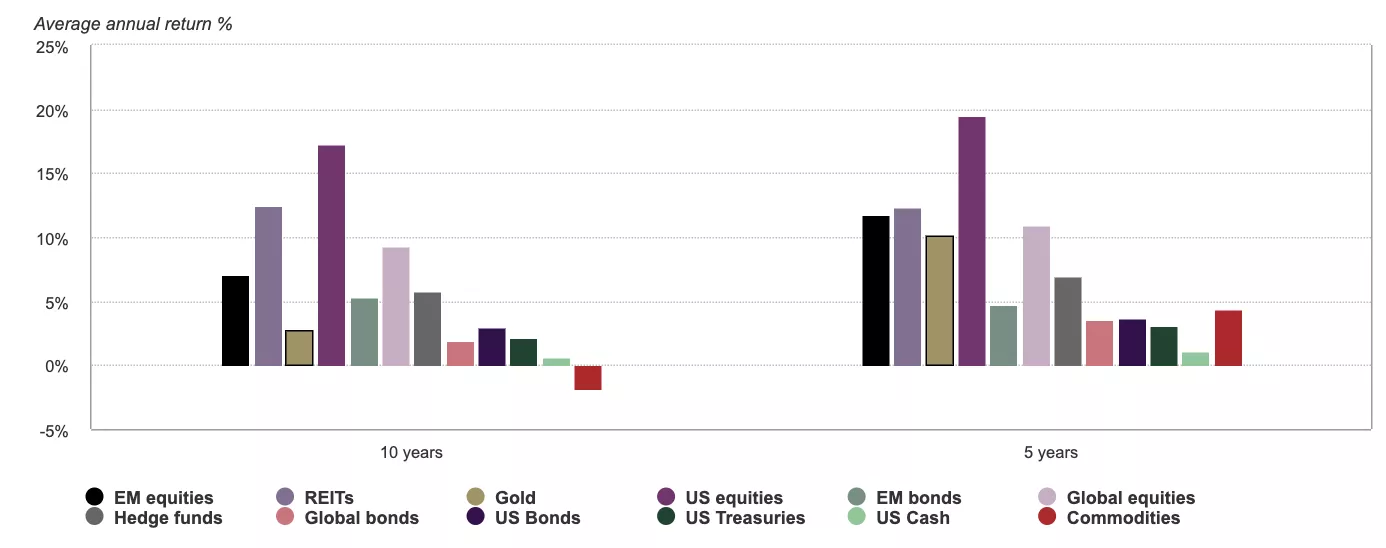
Sources: Bloomberg, ICE Benchmark Administration, World Gold Council
*Returns in US dollars from 31 December 2011 to 31 December 2021. On Goldhub.com see: Gold returns.
Footnotes
[1]IMF 2004 Working Paper: Guidelines for Foreign Exchange Reserve Management.
