Gold has fallen more than US$100/oz over the past month, with the bulk of the decline occurring over two days last week. After trading quietly around US$1,810/oz during the July 4th US Independence Day holiday, gold fell to around US$1,770/oz on Tuesday and then to around US$1,740/oz on Wednesday, where it has remained since.
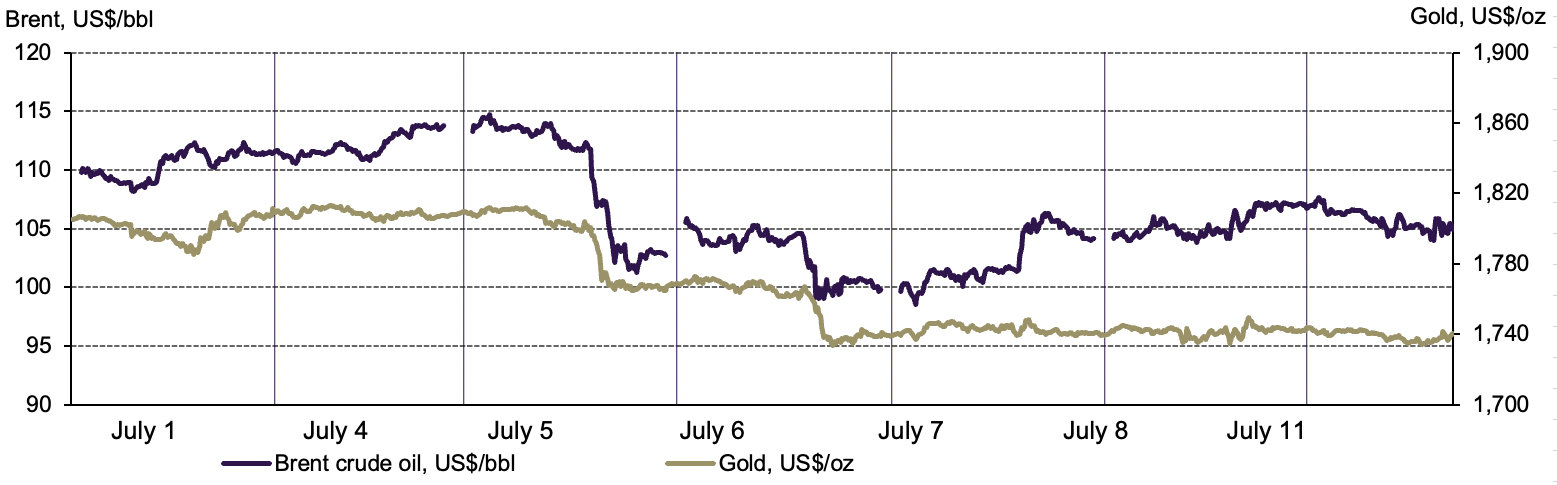
Two major financial indicators appear involved in the move. Firstly, the US dollar has strengthened sharply this week, especially when looking at the trade-weighted DXY index from Bloomberg as a proxy for US dollar strength. Economic weakness in Europe, yen weakness on a failure by Japan to address inflation and political turmoil in the UK are amongst the reasons for the strength of the greenback. Secondly, industrial commodity weakness has been closely associated with the move in gold. There has been a tight correlation between moves in crude oil and gold over the past few days (Chart 1), but other metals have fallen hard too, with copper at lows not seen since late 2020.
Chart 1: Brent crude and gold have been trading closely over the past few days
Notes: 10-minute intraday price bars of spot gold and ICE Brent futures. Gaps in the Brent crude price represent non-trading hours.
Source: Bloomberg, World Gold Council
Recent investment flows in gold have been weak. COMEX gold futures net longs have fallen over the past few weeks and as of last Tuesday – the latest available data – net longs were at their lowest for three years. Most of this move was due to new shorts entering the market. And following two consecutive months of net outflows, gold ETFs have seen a further 25t of outflows month-to-date in July.
We feel there are three major underlying reasons for what has been happening:
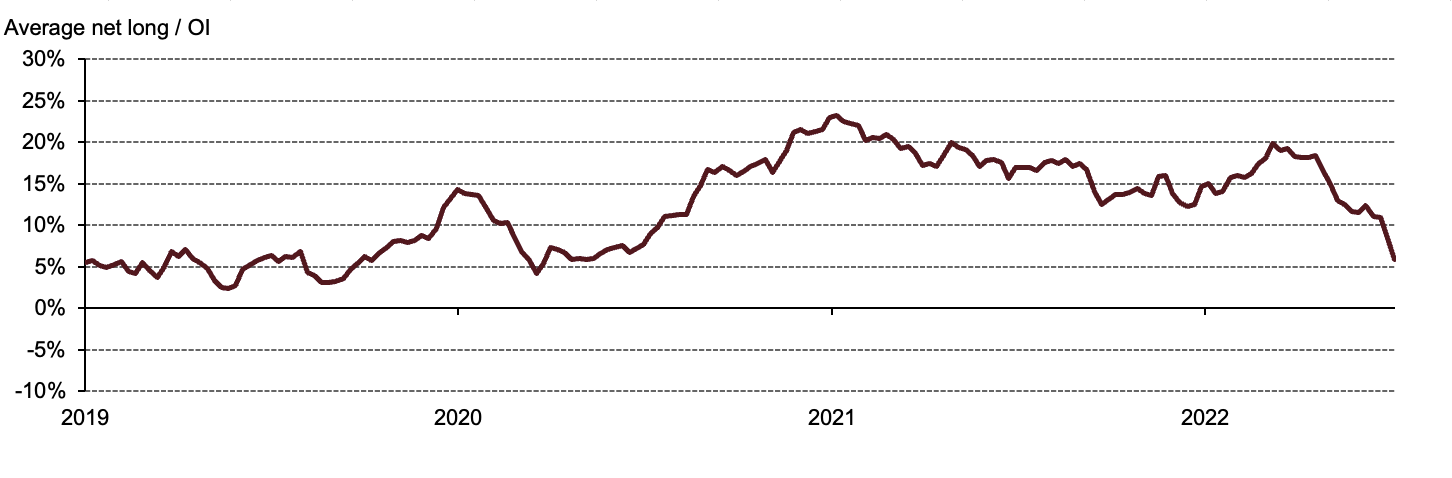
- US economic expectations have shifted from extreme worries about inflation towards growing fears of recession and this has led to a reshuffling of portfolio positioning. Broad-based commodity index selling has occurred, with investors cutting exposure across all commodities (Chart 2), and this has contributed to weakness in gold.
- Secondly, the Fed is talking and acting more aggressively than other major central banks, which is supporting the dollar on expected and realised interest rate differentials. Europe and the UK are stuck with high inflation caused by energy prices rather than domestic demand, so the central banks are being understandably slow to hike here.
- Finally, momentum in gold has played a role. It is likely speculative traders who play gold in the short term were watching US$1800/oz as a key level and, when this gave way, were quick to cut longs or add to shorts. Seasonally, although a poor rationale to trade anything, gold is often weak in the summer, and this adds to their negativity on gold and news of the India duty hike will only have helped that view.
Chart 2: Speculative traders have exited commodity positions en masse in recent weeks
Notes: Average futures net long as a share of open interest across 24 commodities. Net long = non-commercial long + non-reportable long – non-commercial short – non-reportable short. Combined futures and options contracts.
Source: Bloomberg, World Gold Council