In 2013 the gold market saw 21% growth in demand from consumers which contrasted with outflows of 881t from ETFs. The net result was that global gold demand in 2013 was 15% lower than in 2012, with a full year total of 3,756t.
Annual global investment in bars and coins reached 1,654t, up from 1,289t in 2012, a rise of 28%, and the highest figure since the World Gold Council’s data series began in 1992.
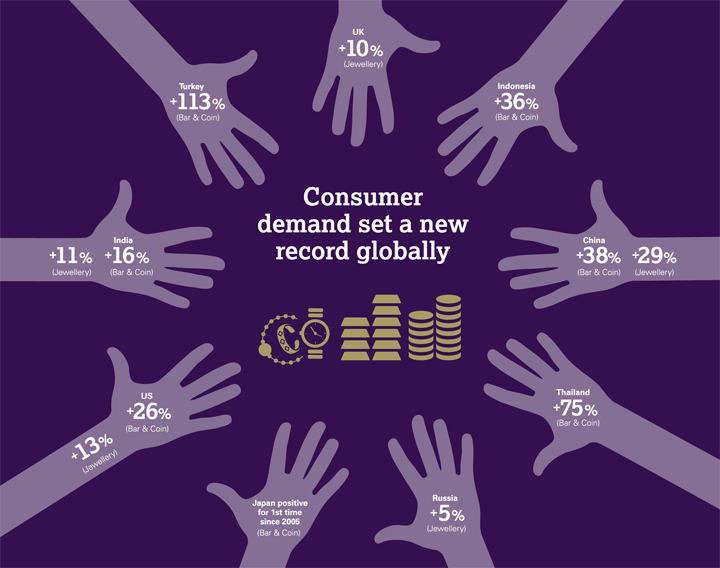
For the full year, Chinese and Indian investment in gold bars and coins was up 38% and 16%, respectively. Although much smaller markets in terms of volume, in the US, bar and coin demand was up 26% to 68t, and in Turkey it was up 113% to 102t, demonstrating solid support on a global basis.
Meanwhile demand for jewellery, the other component of consumer demand, increased by 29% from 519t to 669t in China, and by 11% from 552t to 613t in India, reaching 2,209t globally, the highest figure seen since the onset of the financial crisis in 2008.
Marcus Grubb, Managing Director, Investment Strategy at the World Gold Council commented:
“2013 has been a strong year for gold demand across sectors and geographies, with the exception of western ETF markets. Specifically, it was the year of the consumer. Although demand has continued its shift from West to East, the growing demand for gold bars, coins and jewellery is a global phenomenon.
“Taken together, the statistics demonstrate the resilience of the gold market and the unique nature of gold as an asset class, rebalancing to reflect the economic environment.”
The key findings of the report are as follows:
- Consumers remain key drivers in the demand for gold. Globally, consumers bought 3,864t of gold last year, 21% higher than in 2012. Jewellery demand for the year rose 17% to 2,209t, while investment in bars and coins was up 28% to 1,654t.
- China and India both recorded increased demand in 2013. Consumer demand in China rose 32% in 2013 to a record level of 1,066t, while in India demand rose 13% to 975t.
- Global consumer demand strengthens. Across the world there were large increases in consumer appetite for gold in both emerging and developed markets. Demand in Turkey was up 60%, Thailand up 73% and the US up 18%.
- Indian demand remained strong. Despite several import related curbs during 2013, gold demand remained buoyant, with a full-year total of 975t compared to 864t in 2012. We estimate that unofficial imports almost doubled compared with 2012, to compensate for the decline in official imports.
- Central banks. Although down 32% on 2012 they continued to be strong buyers of gold, a trend which began in 2009. 2013 saw net purchases in all four quarters, totalling 369t, meaning 12 consecutive quarters of net inflows.
- ETFs. There was a net outflow from ETFs of 180t in Q4 as investors continued to re-evaluate their portfolios in response to market conditions. In total, investors redeemed 881t from ETFs in the full year.
- Technology demand reached 405t in 2013, virtually unchanged from the figure of 407t in 2012.
Gold demand and supply statistics for Full Year 2013
- Gold demand for 2013 was 3,756t, 15% lower than for 2012.
- Average price of gold for the year was US$1,411/oz, down 15% on 2012.
- Global demand for jewellery was 2,209t for the year, up 17% on 2012.
- Globally, there was record bar and coin demand for the year, which was up 28% on 2012, to 1,654t.
- Demand in the technology sector was 405t, virtually unchanged from the 407t seen in 2012.
- There was a net outflow from ETFs of 881t, as investors continued to reassess their portfolios.
- Net central bank purchases totalled 369t, 32% down on 2012.
- Total supply for the year was 4,340t, down 2% compared to 2012.
Gold demand and supply statistics for Q4 2013
Consumer demand in China was up 4% in Q4 2013 compared with the same period last year. Consumer demand in India fell by 16% to 219t. Overall, global jewellery demand was up 6%, while total bar and coin fell 6%. Central banks were net purchasers of gold for the 12th consecutive quarter, while there were outflows totalling 180t from ETFs in the quarter.
- Fourth quarter gold demand of 858t was 29% lower than Q4 2012.
- The average price of gold in this quarter was US$1,276/oz, down 26% on Q4 2012.
- Global demand for jewellery was 554t in the quarter, up 6% on last year.
- The consumer investment sector again saw solid bar and coin demand, with the figure slipping just 5% to 327t compared to Q4 2012.
- There was a net outflow from ETFs of 180t, as investors continued to re-evaluate their portfolios in response to market conditions.
- Net central bank purchases totalled 61t.
- Demand in the technology sector was stable once again, totalling 96t, unchanged from the same period last year.
- Total supply for the quarter was 1,124t, up 2%.
Visit the Gold Demand Trends section to download the report.
Ends
For further information please contact:
James Murray
World Gold Council
T +44 (0) 207 826 4754
E [email protected]
Nicola Flynn
Edelman
T +44 (0) 203 047 2587
E [email protected]
