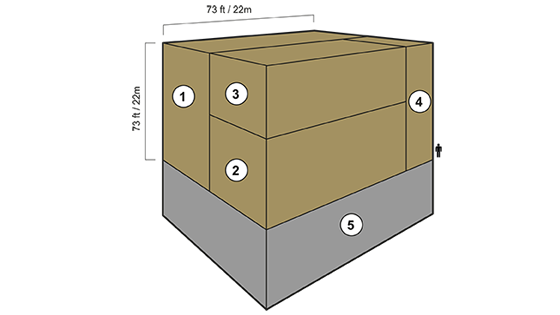
“The best estimates currently available suggest that around 205,238 tonnes of gold has been mined throughout history, of which around two-thirds has been mined since 1950. And since gold is virtually indestructible, this means that almost all of this metal is still around in one form or another. If every single ounce of this gold were placed next to each other, the resulting cube of pure gold would only measure around 22 metres on each side.”
This breakdown of the above-ground stock of gold includes a time series of how it has evolved since 2010, and the latest year-end estimate of below-ground stocks.