Published 2 February, 2021; revised 5 February 2021
How gold’s role in a portfolio differs from cryptocurrencies
The rapid ascent of cryptocurrencies over the past year has drawn the attention of investors. Often, investments in cryptocurrencies1 are equated to investments in gold. Despite some apparent similarities, we believe that gold and cryptocurrencies stands apart fundamentally and practically.
Our analysis demonstrates that:
sources of gold demand are more diverse (p.3)
supply and ownership of cryptocurrencies are more concentrated (p.4)
cryptos have mostly contributed to portfolio performance through returns but have added significant risk (pp.5-6)
gold is a high-quality liquid asset and portfolios with cryptocurrencies may benefit from higher allocations to gold (pp.6-7)
evolving regulatory frameworks may change the value proposition of cryptocurrencies (p.8).
Gold and cryptocurrencies are fundamentally different
The advent of blockchain and cryptocurrencies has catalysed innovation in the financial industry. Their proliferation and recent exponential price increase have captured investors’ imaginations. However, the recent developments in blockchain and cryptocurrencies do not imply that cryptocurrencies are a substitute for gold.
The argument that gold and cryptocurrencies such as2, 3 are similar appears to stem from perceptions of:
their limited supply
their role as alternatives to fiat currencies.
However, this comparison is simplistic and overlooks fundamental differences between gold and cryptocurrencies – not only in terms of their market dynamics but also in terms of their performance and the role they play in portfolios.
Gold has a dual nature
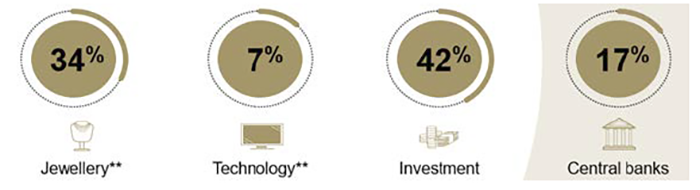
The sources of demand for gold and cryptocurrencies are very different. For more than 2,000 years, gold has served as means of exchange and been used as a store of value.4 Gold is owned by institutional and individual investors, as well as by central banks (Figure 1).
Unlike cryptocurrencies, gold is also a consumer good.
Figure 1: Gold’s demand is linked to investment and consumption
Composition of average annual net demand*
*Based on 10-year average annual net demand estimates ending in 2020. It excludes over-the-counter demand. **Net jewellery and technology demand computed assuming 90% of annual recycling comes from jewellery and 10% from technology.
Source: Metals Focus, Refinitiv GFMS, World Gold Council
Jewellery is an integral part of the gold market. A large portion of gold demand is deeply connected to cultural and religious beliefs, especially in India and China. Gold is also widely used in high-end electronics – including for components in computers, mobile phones and other technology (which, interestingly, are needed to ‘mine’ cryptocurrencies).
This sets gold apart from many assets, giving it a unique dual nature that historically has allowed it to perform well in times of economic stress as well as benefiting from long-term economic expansion. This underpins gold’s strategic role in portfolios as a source of returns as well as an effective diversifier.5
In contrast, cryptocurrencies are digital (non-tangible) assets and, in our view, their current primary – if not only – source of demand is for investment (Table 1). For example, Bitcoin’s recent performance and volatile behaviour may suggest that it primarily responds to price momentum, which is usually linked to more speculative than strategic positioning.
Table 1: Gold has more diverse sources of demand than cryptocurrencies
Stylised overview of sectors of current demand for gold and cryptocurrencies*
Jewellery
Technology
Investment
Central banks
Gold
✔
✔
✔
✔
Cryptocurrencies
X
**
✔
X
*As of 30 December 2020. **Some cryptocurrencies that can be used as ‘smart’ digital contracts may be purchased for applications in technology. Source: World Gold Council
Chart 1: Growth in above-ground stocks of gold remains below the equivalent growth in Bitcoin
Growth in above-ground stocks of gold remains below the equivalent growth in Bitcoin
Annual rate of growth of gold and Bitcoin through mining*
Growth in above-ground stocks of gold remains below the equivalent growth in Bitcoin
Annual rate of growth of gold and Bitcoin through mining*
*As of 31 December 2020.
Source: Bloomberg, bitcoin.org, World Gold Council.
Sources:
Bloomberg,
bitcoin.org,
World Gold Council; Disclaimer
*As of 31 December 2020.
Gold is a unique and scarce natural element
One of the most referenced similarities between gold and cryptocurrencies is scarcity. Gold’s above-ground stocks grew at a rate of 1.7% through mine production in 2020 (Chart 1) – and that rate has not changed much over the past 20 years.6 The stock of Bitcoin is currently increasing at an annual rate close to 3% and is engineered to slowly decline to zero growth around the year 2140.
While both gold and Bitcoin are finite, Bitcoin’s pre-determined number of units in existence may seemingly create an advantage. However, gold’s relevance has been cemented by a combination of elemental physical and chemical properties, as well as a good balance between availability and scarcity. Thus, while there exist other metals and precious metals, such as silver, palladium or platinum, gold was by far the preferred asset used in currency standards and has remained a key component in foreign reserves even after the end of the Bretton-Woods system.
In contrast, nothing prevents additional – and possibly more efficient7 – cryptocurrencies from replacing existing ones or potentially adding to the overall total supply. The crypto space has exploded in recent years, and it is estimated that there are more than 10,000 cryptocurrencies available through various online platforms.8
At present, Bitcoin has benefited from its name recognition and large network effect, but the space is highly competitive, and it is still too early to know how this issue may play out. For example, Bitcoin Cash, which follows the same structure but allows an increased block size to reduce costs and increase speed, was launched a few years ago.9 Various other Bitcoin spinoffs (or ‘forks’) followed.10 And while they are not always prevalent, they are more than just a proof of concept that could result in unforeseen expansions to supply.
Gold production and ownership is diverse
Gold mining is well distributed around the globe. The top five gold producing countries are China, Russia, Australia, the US, and Canada, with various Latin American and African countries not far behind. Average annual production is evenly distributed across regions, with Europe the only continent accounting for less than 10% and no continent capturing more than 25%.11
Equally, ownership of above-ground stocks is widely distributed. The US Treasury is the largest known single holder of gold but only owns 4% of all above-ground stocks. Almost 50% exists in the form of jewellery (distributed globally), while 21% is owned by a large number of investors – individual and institutional – in the form of bars, coins and gold ETFs.12
Concentration risk has been flagged as a key issue for cryptocurrencies. The number of Bitcoin ‘miners’ has been whittled down from thousands to just a handful of key participants. As reported by Bloomberg, “five mining entities – all of them based in China – control 49.9% of all computing power on the network, the highest concentration of mining power ever, a new analysis from TokenAnalyst found”, which, if increased, could pose severe risks to the network.13, 14
Furthermore, while the number of Bitcoin holders has risen over the past year (Chart 2), ownership is very concentrated – just 2% of Bitcoin holders own 95% of all available Bitcoins.15 As a counter-indicator of performance, perhaps as a by-product of the aforementioned concentration, large spikes in the number of unique addresses have historically coincided with significant pullbacks in price.
Chart 2: Sharp increases in Bitcoin ownership have coincided with significant selloffs in recent years
Sharp increases in Bitcoin ownership have coincided with significant selloffs in recent years
Price of Bitcoin compared to daily unique users*
Sharp increases in Bitcoin ownership have coincided with significant selloffs in recent years
Price of Bitcoin compared to daily unique users*
*Total number of unique active addresses, inclusive of senders and receivers.
Source: Bloomberg, blockchain.com
*Total number of unique active addresses, inclusive of senders and receivers.
Gold and crypto prices behave differently
High potential reward brings added risk
Cryptocurrencies have captured the imagination of investors with their exponential growth over the past few years, likely in part due to widespread asset price inflation on the back of ultra-low interest rates. Bitcoin quadrupled in price in 2020 alone and has increased ninefold over the past two years.16 These gains have led some institutional investors to consider, or make some incremental level of investment in, Bitcoin over the past year. However, as with any other financial asset, reward does not come without risk. Not surprisingly, Bitcoin’s ascent has been accompanied by substantial volatility and drawdown risk (Table 2 and Chart 3).
Bitcoin has been three times more volatile than the S&P 500 or the NASDAQ composite over the past two years, and more than four and a half times more volatile than gold.
Table 2: Bitcoin is significantly more volatile than the S&P 500, the NASDAQ composite and gold
Summary of key risk metrics based on weekly returns*
Past 20 years
Past 10 years
Past 2 years
Volatility
% of weekly returns lower than -2.50%
95% VaR per US$10,000
Volatility
% of weekly returns lower than -2.50%
95% VaR per US$10,000
Volatility
% of weekly returns lower than -2.50%
95% VaR per US$10,000
Bitcoin**
NA
NA
NA
16.0%
29.6%
-$1,600
9.9%
26.9%
-$1,382
NASDAQ
3.0%
14.3%
-$476
2.3%
11.2%
-$346
3.2%
8.7%
-$382
S&P 500
2.5%
10.1%
-$390
2.3%
7.5%
-$331
3.3%
8.7%
-$306
Gold
2.5%
10.6%
-$369
2.2%
9.2%
-$319
2.2%
7.7%
-$291
*As of 25 January 2021.
**Bitcoin calculations starts 1 January 2009 due to data availability.
Source: Bloomberg, ICE Benchmark Administration, World Gold Council
Bitcoin has lost 2.5% or more once in four weeks on average compared to once in 12 weeks on average for the S&P 500 or NASDAQ, or once in 13 weeks on average for gold. Finally, Bitcoin’s Value-at-Risk (VaR) has also been considerably higher. On any given week over the past two years, investors had a 5% chance (95% VaR) of losing at least US$1,382 for every US$10,000 invested in Bitcoin – almost five times more than the VaR for an equivalent investment in gold. And while investors may choose to embrace high-reward tactical assets such as Bitcoin, they still need the appropriate tools to manage the additional risk. In our view, a higher exposure to cryptocurrencies warrants a higher allocation to gold.
Bitcoin’s Value-at-Risk is five times higher than that for gold.
Chart 3: Bitcoin’s annual volatility is still multiple times higher than equities and bonds
Chart 3: Bitcoin’s annual volatility is still multiple times higher than equities and bonds
Annualised average daily volatility*
Chart 3: Bitcoin’s annual volatility is still multiple times higher than equities and bonds
Annualised average daily volatility*
*As of 25 January 2021.
Source: DataStream, World Gold Council
Sources:
Datastream,
World Gold Council; Disclaimer
*As of 25 January 2021.
Diversification is not just about low correlation
The correlation between gold and Bitcoin is low, ranging from -0.5 to 0.5 most of the time. And while it was positive on average during 2020, it is still by no means consistent in one direction (Chart 4). This indicates that gold and Bitcoin are not behaving as substitutes.
Furthermore, if Bitcoin were a replacement for gold, it would behave similarly to gold in terms of its reaction to the performance of other assets – in particular, equities. And while both gold and cryptos have generally had relatively low correlation to the equity indices such as the S&P 500 or the NASDAQ composite, it is the correlation when equities fall that matters most to investors as this is usually when diversifiers are most useful.
Chart 4: The correlation between gold and Bitcoin remains low despite an increase seen in 2020
The correlation between gold and Bitcoin remains low despite an increase seen in 2020
Rolling 90-day correlation between gold and Bitcoin*
The correlation between gold and Bitcoin remains low despite an increase seen in 2020
Rolling 90-day correlation between gold and Bitcoin*
*As of 25 January 2021. Based on weekly returns of the LBMA Gold Price PM USD and Bitcoin spot (XBT).
Source: Bloomberg, World Gold Council
Sources:
Bloomberg,
World Gold Council; Disclaimer
*As of 25 January 2021. Based on weekly returns of the LBMA Gold Price PM USD and Bitcoin spot (XBT).
Chart 5: Gold prices tend to increase when tech stocks fall but the same has not been true so far for Bitcoin
Gold prices tend to increase when tech stocks fall but the same has not been true so far for Bitcoin
(a) Scatterplot of gold and the NASDAQ composite when the composite falls by more than 2σ*
Gold prices tend to increase when tech stocks fall but the same has not been true so far for Bitcoin
(a) Scatterplot of gold and the NASDAQ composite when the composite falls by more than 2σ*
*As of 25 January 2021. Based on 5-year daily returns using the LBMA Gold Price PM US and the NASDAQ composite.
Source: Bloomberg, ICE Benchmark Administration, World Gold Council
Sources:
Bloomberg,
ICE Benchmark Administration,
World Gold Council; Disclaimer
*As of 25 January 2021. Based on 5-year daily returns using the LBMA Gold Price PM US and the NASDAQ composite.
Gold prices tend to increase when tech stocks fall but the same has not been true so far for Bitcoin
(b) Scatterplot of Bitcoin and the NASDAQ composite when the composite falls by more than 2σ*
Gold prices tend to increase when tech stocks fall but the same has not been true so far for Bitcoin
(b) Scatterplot of Bitcoin and the NASDAQ composite when the composite falls by more than 2σ*
*As of 25 January 2021. Based on 5-year daily returns using Bitcoin spot prices given by XBT and the NASDAQ composite.
Source: Bloomberg, World Gold Council
Sources:
Bloomberg,
World Gold Council; Disclaimer
*As of 25 January 2021. Based on 5-year daily returns using Bitcoin spot prices given by XBT and the NASDAQ composite.
Here, gold and Bitcoin stand apart. Gold tends to show a negative correlation to equities during significant stock market falls – as seen by the behaviour between gold and NASDAQ (Chart 5a). In contrast, Bitcoin has been equally likely to rally or fall in periods when the NASDAQ tumbled (Chart 5b).
Bitcoin has yet to prove itself as a safe haven
Bitcoin trades like a ‘high-octane’ tactical asset. At times, market participants have noticed ‘safe haven-like’ behaviour in Bitcoin, as it has appeared to directionally move in a similar way to some traditional hedges, such as gold. However, there is no consistent trend.
For example, in March 2020, Bitcoin fell by more than 40% from peak to trough, ending the month down 25% and behaving more similarly to US technology stocks than gold. In contrast, while gold initially fell in March – by 8% from peak to trough – it quickly rebounded to end the month back to the level where it started, and then continued the upward trend as investors added hedges.17
Improving risk-adjusted returns
Some studies have suggested that adding Bitcoin to a hypothetical portfolio would have increased risk-adjusted returns.18 Our own equivalent analysis shows that over the past five years, a 1% to 5% allocation to Bitcoin would have increased the risk-adjusted return of a well-diversified hypothetical portfolio (Chart 6).19 However, the improvement would have come from Bitcoin’s rapid price appreciation and not from a reduction of portfolio volatility, as one would expect from a diversifier or safe-haven asset. In contrast, gold’s portfolio impact over the same period would have come from both a contribution to portfolio returns as well as a reduction in volatility. This highlights gold’s relevance as a strategic risk-management tool in asset allocation.
Our analysis also shows that the same hypothetical portfolio with a 2.5% allocation20 to Bitcoin and a 1% to 10% allocation to gold21 would have improved risk-adjusted returns even further over the same period.
Chart 6: Gold improved risk-adjusted returns and reduced drawdown risk on a well-diversified portfolio containing Bitcoin
Gold improved risk-adjusted returns and reduced drawdown risk on a well-diversified portfolio containing Bitcoin
Performance of a hypothetical well-diversified investment portfolio with various allocations to Bitcoin and gold*
Gold improved risk-adjusted returns and reduced drawdown risk on a well-diversified portfolio containing Bitcoin
Performance of a hypothetical well-diversified investment portfolio with various allocations to Bitcoin and gold*
*Based on performance between 31 December 2015 and 31 December 2020. The hypothetical average well-balanced portfolio (in US dollars) is based on the American Association of Individual Investors average allocations over the past 20 years, along with a combination of the 2019 US Trust High Net Worth allocation survey, and the 2020 MS GIC Capital Markets Update paper. It includes quarterly rebalanced total returns of a 47% allocation to equities (23% MSCI USA Net Total Return, 18% MSCI ACWI ex US, 6% MSCI Emerging Net Total Return), 36% allocation to fixed income (26% Barclays US Aggregate, 3% Barclays Global Aggregate ex US, 1% JPMorgan EM Global Bond Index and 6% short-term Treasuries), and 17% alternative assets (3% FTSE REITs Index, 11% HFRI Hedge Fund Index, and 3% Bloomberg Commodity Index). The allocation to gold and Bitcoin comes from proportionally reducing all assets. Bitcoin returns based on the Bitcoin price in US dollars aggregated by Bloomberg (XBT). Gold prices based on LBMA Gold PM. Risk-adjusted returns are calculated as the annualised return/annualised volatility. Maximum drawdown is calculated as the largest fall in a portfolio before the total value reaches a previous peak. See important disclaimers and disclosures at the end of this report.
Source: Bloomberg, ICE Benchmark Administration, World Gold Council
Sources:
Bloomberg,
ICE Benchmark Administration,
World Gold Council; Disclaimer
*Based on performance between 31 December 2015 and 31 December 2020.The hypothetical average well-balanced portfolio (in US dollars) is based on the American Association of Individual Investors average allocations over the past 20 years, along with a combination of the 2019 US Trust High Net Worth allocation survey, and the 2020 MS GIC Capital Markets Update paper. It includes quarterly rebalanced total returns of a 47% allocation to equities (23% MSCI USA Net Total Return, 18% MSCI ACWI ex US, 6% MSCI Emerging Net Total Return), 36% allocation to fixed income (26% Barclays US Aggregate, 3% Barclays Global Aggregate ex US, 1% JPMorgan EM Global Bond Index and 6% short-term Treasuries), and 17% alternative assets (3% FTSE REITs Index, 11% HFRI Hedge Fund Index, and 3% Bloomberg Commodity Index). The allocation to gold and Bitcoin comes from proportionally reducing all assets. Bitcoin returns based on the Bitcoin price in US dollars aggregated by Bloomberg (XBT). Gold prices based on LBMA Gold PM. Risk-adjusted returns are calculated as the annualised return/annualised volatility. Maximum drawdown is calculated as the largest fall in a portfolio before the total value reaches a previous peak. See important disclaimers and disclosures at the end of this report.
Gold improved risk-adjusted returns and reduced drawdown risk on a well-diversified portfolio containing Bitcoin
Performance of a hypothetical well-diversified investment portfolio with various allocations to Bitcoin and gold*
Gold improved risk-adjusted returns and reduced drawdown risk on a well-diversified portfolio containing Bitcoin
Performance of a hypothetical well-diversified investment portfolio with various allocations to Bitcoin and gold*
*Based on performance between 31 December 2015 and 31 December 2020. The hypothetical average well-balanced portfolio (in US dollars) is based on the American Association of Individual Investors average allocations over the past 20 years, along with a combination of the 2019 US Trust High Net Worth allocation survey, and the 2020 MS GIC Capital Markets Update paper. It includes quarterly rebalanced total returns of a 47% allocation to equities (23% MSCI USA Net Total Return, 18% MSCI ACWI ex US, 6% MSCI Emerging Net Total Return), 36% allocation to fixed income (26% Barclays US Aggregate, 3% Barclays Global Aggregate ex US, 1% JPMorgan EM Global Bond Index and 6% short-term Treasuries), and 17% alternative assets (3% FTSE REITs Index, 11% HFRI Hedge Fund Index, and 3% Bloomberg Commodity Index). The allocation to gold and Bitcoin comes from proportionally reducing all assets. Bitcoin returns based on the Bitcoin price in US dollars aggregated by Bloomberg (XBT). Gold prices based on LBMA Gold PM. Risk-adjusted returns are calculated as the annualised return/annualised volatility. Maximum drawdown is calculated as the largest fall in a portfolio before the total value reaches a previous peak. See important disclaimers and disclosures at the end of this report.
Source: Bloomberg, ICE Benchmark Administration, World Gold Council
Sources:
Bloomberg,
ICE Benchmark Administration,
World Gold Council; Disclaimer
*Based on performance between 31 December 2015 and 31 December 2020.The hypothetical average well-balanced portfolio (in US dollars) is based on the American Association of Individual Investors average allocations over the past 20 years, along with a combination of the 2019 US Trust High Net Worth allocation survey, and the 2020 MS GIC Capital Markets Update paper. It includes quarterly rebalanced total returns of a 47% allocation to equities (23% MSCI USA Net Total Return, 18% MSCI ACWI ex US, 6% MSCI Emerging Net Total Return), 36% allocation to fixed income (26% Barclays US Aggregate, 3% Barclays Global Aggregate ex US, 1% JPMorgan EM Global Bond Index and 6% short-term Treasuries), and 17% alternative assets (3% FTSE REITs Index, 11% HFRI Hedge Fund Index, and 3% Bloomberg Commodity Index). The allocation to gold and Bitcoin comes from proportionally reducing all assets. Bitcoin returns based on the Bitcoin price in US dollars aggregated by Bloomberg (XBT). Gold prices based on LBMA Gold PM. Risk-adjusted returns are calculated as the annualised return/annualised volatility. Maximum drawdown is calculated as the largest fall in a portfolio before the total value reaches a previous peak. See important disclaimers and disclosures at the end of this report.
Furthermore, a 1% allocation to Bitcoin alongside a 10% allocation to gold resulted in risk-adjusted return equivalent to a 2.5% allocation to Bitcoin without gold, but the portfolio with gold would have had a significantly lower maximum drawdown. Overall, this not only suggests that Bitcoin fails to replace gold’s role in a portfolio, but also that adding Bitcoin to a portfolio may warrant a higher allocation to gold, likely as a way of managing the additional volatility.
Adding Bitcoin to a portfolio may warrant a higher allocation to gold.
Interestingly, we also found that a 1% allocation to Bitcoin – often viewed as a tech investment – would have given the same risk-adjusted return as a 7.5% allocation to major US tech companies – in particular, the so-called FAANGs.22 Yet, the allocation to FAANGs would have also resulted in a lower maximum drawdown.
Bitcoin has so far improved the efficiency of portfolios through extremely high returns, which are by no means guaranteed to continue at the same rate.
Gold’s liquidity helps investors manage risk
Gold trades in a well-established and liquid market. Collectively, gold trading volumes exceeded US$180bn a day on average in 2020 between over-the-counter transactions (primarily through spot), futures and gold ETFs.23 This in turn helped keep bid-ask spreads of most gold-traded instruments quite tight – usually less than a couple of basis points – thus giving investors the ability to easily enter or exit their gold positions.24
In contrast, Bitcoin spot trading volumes – which can vary widely from source to source and are not always easy to verify – were estimated to be less than US$2bn, on average, in 2020, with a range up to US$4bn.25 And while volumes seem to have increased substantially so far in 2021 reaching levels close to US$10nb,26 reporting in online platforms is not regulated and may not be homogeneous.
Additionally, the number of Bitcoin transactions as a function of its market cap has decreased to almost zero (Chart 7). We believe that this trend could indicate insufficient liquidity in the market if many investors, or even one large one, were to attempt to exit the market. And anecdotal evidence suggests that bid-ask spreads not only remain wide but vary substantially.
Bitcoin transaction velocity has waned, raising potential liquidity concerns
Transactions per second per US$1 million*
Bitcoin transaction velocity has waned, raising potential liquidity concerns
Transactions per second per US$1 million*
*As of 25 January 2021. Represents number of transactions per second divided by the total market capitalisation for Bitcoin in US-dollar millions.
Source: blockchair.com, blockchain.com, World Gold Council
Sources:
blockchain.com,
blockchair.com,
World Gold Council; Disclaimer
*As of 25 January 2021. Represents number of transactions per second divided by the total market capitalisation for Bitcoin in US-dollar millions.
An evolving regulatory environment
Some crypto enthusiasts have argued that Bitcoin could replace traditional currencies in transactions.27 While some vendors do accept Bitcoin, on average only about 340,000 Bitcoin out of approximately 18 million in existence are used for daily transactions, which is less than 2%.28 In comparison, the US dollar transacted nearly US$6trn per day on average in 2019. At the time, this represented 40% of the total M2.29
This may also be in part because Bitcoin lacks the regulatory framework to appropriately function as a means of exchange. Furthermore, limitations of the network itself could prevent widespread adoption.30 Bitcoin’s network capacity is fewer than 10 transactions per second, approximately, compared to VisaNet – Visa’s payment network – which reportedly can handle up to 65,000 transactions per second. This limitation is well known, and many possible solutions have been suggested, but these would either change Bitcoin fundamentally or rely on less secure but higher capacity parallel (‘off chain’) networks such as Lightning.31, 32
Perhaps more importantly, widespread adoption of cryptocurrencies would likely result in more extensive government regulation.33 We believe this may stem from two key considerations: consumer protection and policy efficacy. For example, effective monetary policy requires a central bank to be able to control money supply. At a hypothetical extreme, if individuals do not transact in an official currency but in an independent cryptocurrency, monetary policy becomes moot. Of course, government intervention would occur before that happened. And while regulation may not remove the viability of cryptocurrencies altogether, it may change their investment proposition, objectives and, likely, their performance.
In recent years, partly because of concerns surrounding ‘stablecoins’ such as Diem (formerly known as Libra),34 governments have looked more closely at digital assets. Specifically, there has been growing interest in the development of digital versions of national currencies, also known as Central Bank Digital Currencies (Focus 1). This may, in turn, catalyse changes to the regulatory environment of cryptocurrencies.35
Focus 1: Central Bank Digital Currencies
Central banks are establishing frameworks that would, at some point, allow them to develop digital versions of assets known as Central Bank Digital Currencies or CBDCs. These would likely be created as digital versions (either in public or private ledgers) of their own currencies, often to reduce costs, increase access, and improve their financial system infrastructure.36 While many central banks are looking into this, emerging market central banks may be the ones to pioneer the use of CBDCs: their financial systems are less mature and CBDCs may allow them to improve their financial infrastructure.37
Central banks often see cryptocurrencies, such as Bitcoin, as having a different value proposition to that of CBDCs.38 But if the success of these types of cryptocurrencies were to limit the ability of governments and central banks to appropriately enact monetary or fiscal policy or undermine seigniorage revenue, it would likely result in a stricter regulatory environment for all crypto assets.
Gold is proven and established
Our analysis suggests that gold stands apart from cryptocurrencies in general and Bitcoin in particular. Gold is an effective, tried and tested investment tool in portfolios. It has been a source of returns rivalling that of the stock market over various time horizons; it has performed well during periods of inflation; it has been a highly liquid, established market; and it has acted as an important portfolio diversifier, exemplifying negative correlation to the market during downturns.
The recent performance of cryptocurrencies has been noteworthy, but their purpose as an investment seems quite different from gold. The crypto market is still in development, and liquidity is scarce. We believe that their price behaviour at this point, while still attractive to many investors, seems to be driven in large part by high return expectations – fuelled by momentum and aided by low interest rates.
Focus 2: Drivers of gold performance
Gold’s behaviour can be explained by four broad sets of drivers:
Economic expansion: periods of growth are very supportive of jewellery, technology and long-term savings
Risk and uncertainty: market downturns often boost investment demand for gold as a safe haven
Opportunity cost: interest rates and relative currency strength influence investor attitudes towards gold
Momentum: capital flows, positioning and price trends can ignite or dampen gold’s performance.
These, in turn, can be used to better understand the performance of gold through our Gold Valuation Framework (GVF). Further, investors can use Qaurum, a web-based quantitative tool powered by GVF, to calculate the hypothetical performance of gold implied under various available (user-customisable) macroeconomic scenarios provided by Oxford Economics.39
Gold, too, is likely to perform well in a low-rate environment, but its behaviour responds to four key drivers that, based on our analysis, underpin the relevance of gold as a strategic asset (Focus 2).
This explains not only why gold is uncorrelated to all major assets held in the typical investor portfolio but also why – fundamentally – cryptocurrencies do not replace gold’s role in a portfolio. Indeed, our 2019 investor survey indicates that gold and Bitcoin can play different roles in portfolios: investors see Bitcoin more often as speculative while they see gold as a means to protect wealth (Chart 8). Similarly, our conversations with institutional investors seem to suggest that gold and Bitcoin are seen as having different value propositions.
As such, as financial markets continue to evolve and new technologies develop, we believe that gold’s unique attributes and its contribution to investment portfolios make it a relevant long-term strategic investment.
Chart 8: Individual investors more often view Bitcoin as speculative and gold as a means to protect wealth
Individual investors more often view Bitcoin as speculative and gold as a means to protect wealth
Individual investors’ views of the roles that gold and Bitcoin play in portfolios*
Individual investors more often view Bitcoin as speculative and gold as a means to protect wealth
Individual investors’ views of the roles that gold and Bitcoin play in portfolios*
*As of August 2019. Results from a quantitative survey carried out by Hall & Partners of at least 2,000 men and women in China, India, Germany, the US, Canada and Russia each. The survey was online in all markets, except rural India where the agency conducted 1,000 face-to-face interviews. These were active retail investors – classified as people who had made at least one investment in the past 12 months, excluding those who had only added money to a savings account and had only ever invested in a defined list of non-core investment products. Fieldwork for both surveys took place in Q2 and Q3 2019. Results are global responses to the question ‘How would you describe the main role of this investment?’. The options were: To make a positive impact on society/the environment; Speculative/high risk with the potential for very high returns; To make good returns (in excess of inflation) in the short term; To protect my wealth; To make good returns (in excess of inflation) in the long term. Options also included ‘Don’t know’ and ‘Other’, but percentages are not significant enough to show in the chart. Respondents answered for each investment product that they owned at the time. For gold, these include coins, bars, gold ETFs, vaulted gold, as well as gold jewellery in the case of Indian and Chinese respondents. Base: Currently own both gold (in any of the above) and crypto investments (631). For more info see: Retail gold market analysis and insights.
Source: Hall & Partners, World Gold Council
Sources:
Hall & Partners,
World Gold Council; Disclaimer
*As of August 2019. Results from a quantitative survey carried out by Hall & Partners of at least 2,000 men and women in China, India, Germany, the US, Canada and Russia each. The survey was online in all markets, except rural India where the agency conducted 1,000 face-to-face interviews. These were active retail investors – classified as people who had made at least one investment in the past 12 months, excluding those who had only added money to a savings account and had only ever invested in a defined list of non-core investment products. Fieldwork for both surveys took place in Q2 and Q3 2019. Results are global responses to the question ‘How would you describe the main role of this investment?’. The options were: To make a positive impact on society/the environment; Speculative/high risk with the potential for very high returns; To make good returns (in excess of inflation) in the short term; To protect my wealth; To make good returns (in excess of inflation) in the long term. Options also included ‘Don’t know’ and ‘Other’, but percentages are not significant enough to show in the chart. Respondents answered for each investment product that they owned at the time. For gold, these include coins, bars, gold ETFs, vaulted gold, as well as gold jewellery in the case of Indian and Chinese respondents. Base: Currently own both gold (in any of the above) and crypto investments (631). For more info see: Retail gold market analysis and insights.
1We use cryptos interchangeably with cryptocurrencies through the note for stylistic purposes.
2Bitcoin first appeared in the literature in late 2008 – likely due to the disenchantment many market participants had with the financial system during the Global Financial Crisis – with the open-source software released in early 2009. Bitcoin was initially viewed as a means to increase trust in transactions, reduce costs and bypass private ledgers. Since then, thousands of cryptocurrencies and, more generally, crypto assets have hit the market. While all these can vary in many ways, they are generally built based on blockchain technology – a type of database that allows “digital information to be recorded and distributed but not edited”. Investopedia, Blockchain explained, November 2020.
3Throughout this report, we primarily use Bitcoin for comparison in terms of performance and other metrics as it the cryptocurrency with the largest market capitalisation and with the longest available historical data.
29M2 includes cash and checking deposits, as well as savings deposits, money market securities, mutual funds, and other time deposits. Transactions data sourced from the US Federal Reserve and the BIS.
36Should the Central Bank Issue E-Money? C. Khan et al, FRB St. Louis Working Paper No. 2019-3, January 2019; A Course on CBDCs, F. Rivadeneyra, Bank of Canada mimeo, 2020. For more information, see Digital Currencies and FinTech.
Reproduction or redistribution of any of this information is expressly prohibited without the prior written consent of World Gold Council or the appropriate copyright owners, except as specifically provided below.
The use of the statistics in this information is permitted for the purposes of review and commentary (including media commentary) in line with fair industry practice, subject to the following two pre-conditions: (i) only limited extracts of data or analysis be used; and (ii) any and all use of these statistics is accompanied by a citation to World Gold Council and, where appropriate, to Metals Focus, Refinitiv GFMS or other identified copyright owners, as their source. World Gold Council is affiliated with Metals Focus.
Neither the World Gold Council nor any of its affiliates (collectively, “WGC”) guarantees the accuracy or completeness of any information. WGC does not accept responsibility for any losses or damages arising directly or indirectly from the use of this information.
This information is for educational purposes only. Nothing contained herein is intended to constitute a recommendation, investment advice, or offer for the purchase or sale of gold, any gold-related products or services or any other products, services, securities or financial instruments (collectively, “Services”). This information does not take into account any investment objectives, financial situation or particular needs of any particular person.
By receiving this information, you agree with the intended purpose of this information as being for educational purposes only. Diversification does not guarantee any investment returns and does not eliminate the risk of loss.
Investors should discuss their individual circumstances with their appropriate investment professionals before making any decision regarding any Services or investments.
This information contains forward-looking statements, such as statements which use the words “believes”, “expects”, “may”, or “suggests”, or similar terminology, which are based on current expectations and are subject to change. Forward-looking statements involve a number of risks and uncertainties. There can be no assurance that any forward-looking statements will be achieved. WGC assumes no responsibility for updating any forward-looking statements.
Information regarding QaurumSM and the Gold Valuation Framework
Note that the resulting performance of various investment outcomes that can generated through use of Qaurum, the Gold Valuation Framework and other information are hypothetical in nature, may not reflect actual investment results and are not guarantees of future results. Diversification does not guarantee investment returns and does not eliminate the risk of loss. World Gold Council and its affiliates and subsidiaries (collectively, “WGC”) provide no warranty or guarantee regarding the functionality of the tool, including without limitation any projections, estimates or calculations.